Microsoft Excel Tutorial - Create a Graph of Data in a Spreadsheet
Step by Step: Creating a graph (Chart) in Excel
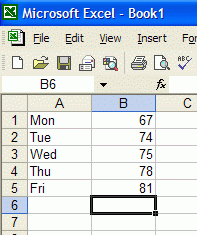
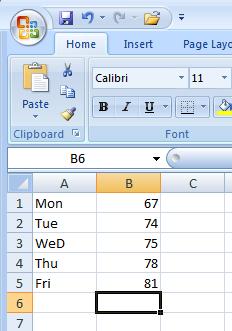
Type in the data to be graphed. The categories are in the first column and the values are in the second column. As you can see, there are no essential differences between Excell 2003 and Excel 2007 at this point.
 -
- 
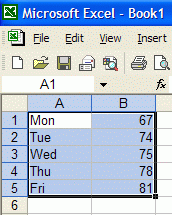
Next, select the data you want to graph. Select means to highlight the data. Start at the top on the left and drag down to the right. The first cell will remain white, but WILL be included in the selection.
 -
- 
The next section will show graph creation for Excel 2003. The Excel 2007 section will follow. For Excel 2003, click on the little “Bar Chart” icon in the toolbar or choose Chart … under the Insert Menu. ![]()
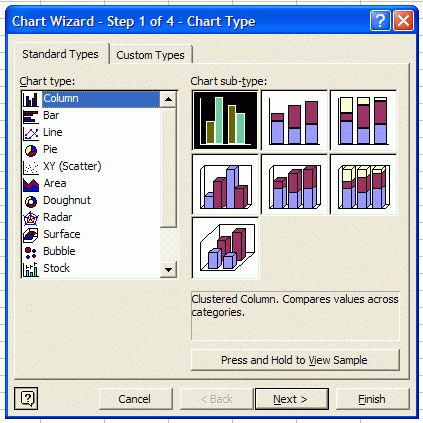
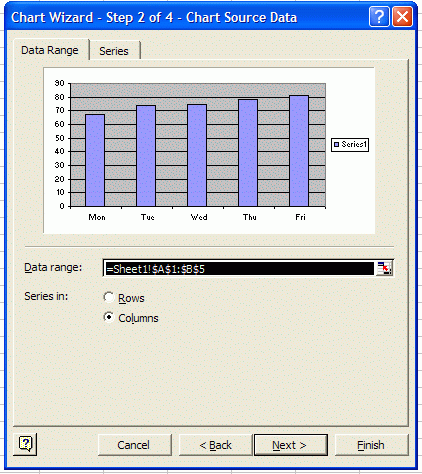
Choose your graph. Click Next. Click Next again.
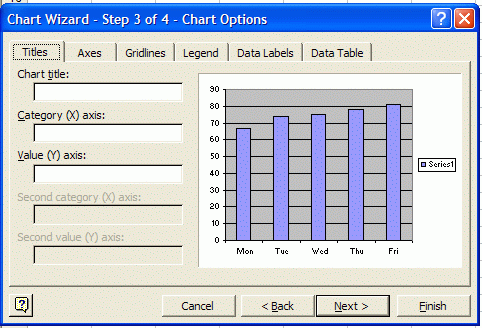
Now fill in the Title and labels for the axes.
The last choice you make is between “A new sheet” or “As object in sheet.”
"As object in sheet" will place the graph on the sheet next to the data.
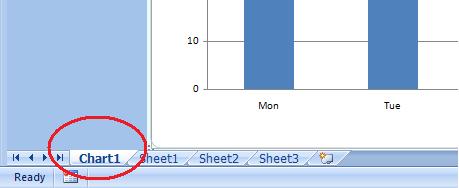
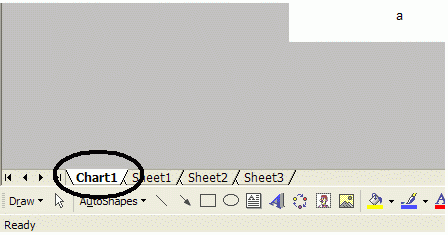
"A new sheet" means that the graph will placed on a completely new page called Chart1. You can see it by clicking on the tab at the bottom of the page.
Creating a chart (graph) in Excel 2007
You have typed in the data and selected it.

The next step is to go to the Insert tab and choose the type of graph you wish to create.

When you click on a chart type, you will see the kinds of charts available.
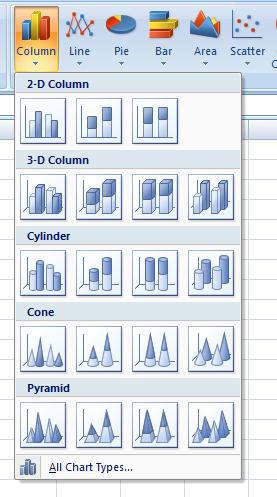
For this tutorial, the simple 2-D Column chart will be selected. The chart is automatically created. The chart can be moved and resized easily.

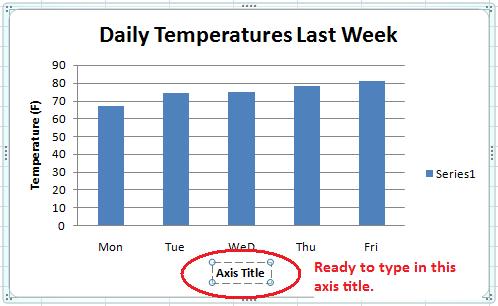
Next, we need to add in chart title and axis titles. To do this we need to change the chart layout. The layout options are in the Insert tab and appear automatically when the chart is selected. If you choose Layout #9 you will be able to add in axis titles.
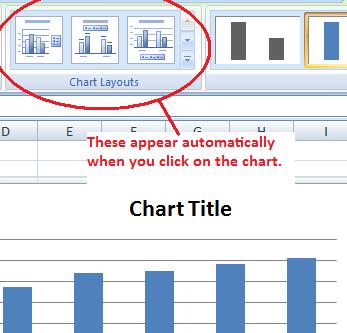
Layout #9 is shown below. Click on the Chart Title and axis labels to change them.
If you wish to have the chart not floating in the spreadsheet, you may "move" it to it's own page. To do this, click on the "Move Chart" button on the far right of the Design tab.
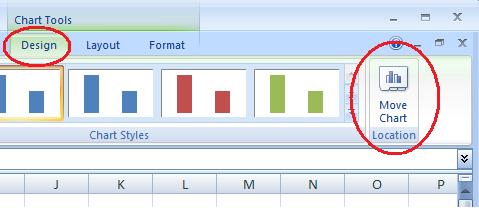
This will allow you to "move" the chart to it's own page.
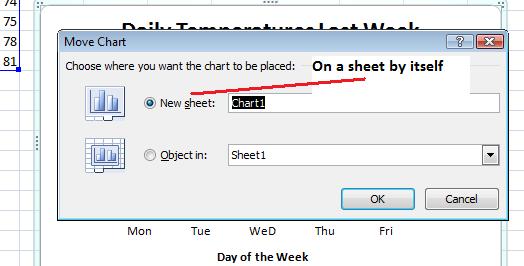
This results in a chart that is accessable from the tabs at the bottom of the screen.
