EZPlot - easy to use c plot package
Were you looking for EZPLOT for Excel instead?
EZ-Plot c library
| Summary: | This describes the EZPlot library. The library allows c programs to easily make jpg or png graphs of data. |
|---|---|
| Version: | 1.4 |
| Download: | Current version: ezp-1.4 |
EZ-Plot needs the following graphics libraries:
The library is currently available on several Uinversity of Washington uniform access systems, including ovid and vergil.
Start with a few definitions.
- An image is the entire picture (jpg or png) that you are creating.
- On the image you place one or more graphs. Each graph has one x-axis and one y-axis, a caption and tick marks for each, and one or more sets of plotted data.
- Each graph contains one or more plots of x-y pairs of data. The plotted points may be discrete (histogram) or continuous (line plot).
The steps to make an easyplot image are roughly as follows.
- Create an image
- Allocate some colors
- The first color allocated will be the background color.
- The second color allocated will be the foreground color. Foreground color is used for captions, labels, and tick marks.
- Create some plot styles
- Title the image
- Create a graph
- Add captions
- plot data
- Save the image to file
.PROCEDURE-SECTION Library API
All programs using the ezp api must include
#include "ezp.h"
-lezp -lgd -ljpeg -lpng -lz -lm
The include file defines a structure
typedef union {
  int64 i;
  double f;
} V;
that you will use to pass data to the library.
The image is the entire picture (jpg or png) that you are creating. All other activity takes place on an image or its children.
ezp_create_image
| Description: | Creates an image | ||||
|---|---|---|---|---|---|
| Syntax: | EZP_Image ezp_create_image(int width, int height) | ||||
| Arguments: |
| ||||
| Return: | An EZP_Image | ||||
| Errors: |
| ||||
| Notes: |
|
ezp_allocate_color
| Description: | Choose a color by name | ||||
|---|---|---|---|---|---|
| Syntax: | EZP_Color ezp_allocate_color(EZP_Image image, char* color_name) | ||||
| Arguments: |
| ||||
| Return: | An EZP_Color | ||||
| Errors: |
| ||||
| Notes: |
|
ezp_allocate_rbgcolor
| Description: | Choose a color by RGB vlaues | ||||||||
|---|---|---|---|---|---|---|---|---|---|
| Syntax: | EZP_Color ezp_allocate_rgbcolor(EZP_Image image, int red, int green, int blue) | ||||||||
| Arguments: |
| ||||||||
| Return: | An EZP_Color | ||||||||
| Errors: |
| ||||||||
| Notes: |
|
ezp_image_title
| Description: | Title an image | ||||||
|---|---|---|---|---|---|---|---|
| Syntax: | void ezp_image_title(EZP_Image image, char* title, EZP_Color color) | ||||||
| Arguments: |
| ||||||
| Return: | |||||||
| Errors: |
| ||||||
| Notes: |
|
ezp_save_image
| Description: | Save the image to a file | ||||||
|---|---|---|---|---|---|---|---|
| Syntax: | int ezp_save_image(EZP_Image image, int type, char* filename) | ||||||
| Arguments: |
| ||||||
| Return: | 1 if OK, zero if the file could not be written. | ||||||
| Errors: |
| ||||||
| Notes: |
|
ezp_write_image
| Description: | Write the image to a file pointer | ||||||
|---|---|---|---|---|---|---|---|
| Syntax: | int ezp_write_image(EZP_Image image, int type, FILE* filepointer) | ||||||
| Arguments: |
| ||||||
| Return: | 1 if OK, zero if the file could not be written. | ||||||
| Errors: |
| ||||||
| Notes: |
|
One or more graphs are positioned on an image. Each graph has one x-axis and one y-axis, a caption and tick marks for each, and one or more sets of plotted data.
Each graph axis can be padded (stretched) to make the long tick marks align with the border. Use ezp_set_graph_pad_flags to control axis padding.
ezp_create_graph
| Description: | Create a graph | ||||||
|---|---|---|---|---|---|---|---|
| Syntax: | EZP_Graph ezp_create_graph(EZP_Image image, int xtype, int ytype) | ||||||
| Arguments: |
| ||||||
| Return: | An EZP_Graph | ||||||
| Errors: |
| ||||||
| Notes: |
|
ezp_graph_captions
| Description: | Add graph captions | ||||||||
|---|---|---|---|---|---|---|---|---|---|
| Syntax: | void ezp_graph_captions(EZP_Graph graph, char* x_caption, char* y_caption, EZP_Color color) | ||||||||
| Arguments: |
| ||||||||
| Return: | |||||||||
| Errors: |
| ||||||||
| Notes: |
|
ezp_set_graph_pad_flags
| Description: | Set a graph's padding | ||||||
|---|---|---|---|---|---|---|---|
| Syntax: | void ezp_set_graph_pad_flags(EZP_Graph graph, int x_pad, int y_pad) | ||||||
| Arguments: |
| ||||||
| Return: | |||||||
| Errors: |
| ||||||
| Notes: |
|
ezp_set_graph_label_cb
| Description: | Set a graph's label callbacks | ||||||
|---|---|---|---|---|---|---|---|
| Syntax: | void ezp_set_graph_label_cb(EZP_Graph graph, char* (*xcb), char* (*ycb)) | ||||||
| Arguments: |
| ||||||
| Return: | |||||||
| Errors: |
| ||||||
| Notes: |
|
ezp_position_graph
| Description: | Position graphs on an image | ||||||||||
|---|---|---|---|---|---|---|---|---|---|---|---|
| Syntax: | void ezp_position_graph(EZP_Graph graph, double x, double y, double w, double h) | ||||||||||
| Arguments: |
| ||||||||||
| Return: | |||||||||||
| Errors: |
| ||||||||||
| Notes: |
|
ezp_get_graph_attrs
| Description: | Get a graph's attributes | |||||||||||||||||||||||||||
|---|---|---|---|---|---|---|---|---|---|---|---|---|---|---|---|---|---|---|---|---|---|---|---|---|---|---|---|---|
| Syntax: | EZP_Graph_attrs ezp_get_graph_attrs(EZP_Graph graph) | |||||||||||||||||||||||||||
| Arguments: |
| |||||||||||||||||||||||||||
| Return: | An _EZP_Graph_attrs | |||||||||||||||||||||||||||
| Errors: |
| |||||||||||||||||||||||||||
| Notes: |
| |||||||||||||||||||||||||||
Each graph contains one or more plots of x-y pairs of data. The plotted points may be discrete (histogram) or continuous (line plot).
ezp_create_style
| Description: | Create a plot style | |||||||||||||||||||||||||||||||||||
|---|---|---|---|---|---|---|---|---|---|---|---|---|---|---|---|---|---|---|---|---|---|---|---|---|---|---|---|---|---|---|---|---|---|---|---|---|
| Syntax: | EZP_Style ezp_create_style(int style, int d1, int d2, EZP_Color color) | |||||||||||||||||||||||||||||||||||
| Arguments: |
| |||||||||||||||||||||||||||||||||||
| Return: | An EZP_Style | |||||||||||||||||||||||||||||||||||
| Errors: |
| |||||||||||||||||||||||||||||||||||
| Notes: |
|
ezp_plot_xy
| Description: | Plot some data | ||||||||||||
|---|---|---|---|---|---|---|---|---|---|---|---|---|---|
| Syntax: | void ezp_plot_xy(EZP_Graph graph, V *x, V *y, int num, EZP_Style style, char* legend) | ||||||||||||
| Arguments: |
| ||||||||||||
| Return: | An EZP_Color | ||||||||||||
| Errors: |
| ||||||||||||
| Notes: |
|
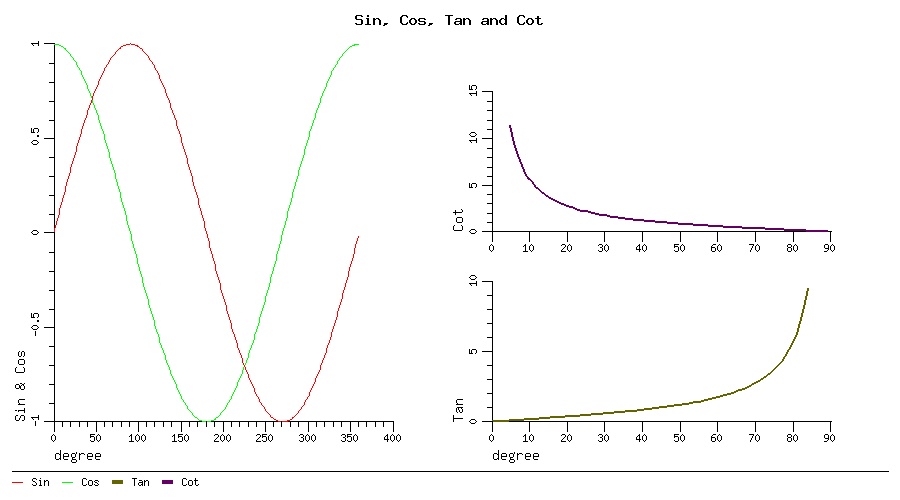
Simple trig functions
This program
/* Plot sine and cosine */


V x[360];
V ysin[360];
V ycos[360];
V ytan[360];
V ycot[360];
int nxy = 360;
int ntan = 85;

double twopi = 2.0 * 3.141592653589793;

void show_attrs(char *name, EZP_Graph_attrs ga)
{
  fprintf(stderr, "For %s:\n", name);
  fprintf(stderr, "    xp/yp = %d/%d\n", ga->xp, ga->yp);
  fprintf(stderr, "    xo/yo = %d/%g\n", ga->xo.i, ga->yo.f);
  fprintf(stderr, "    xs/ys = %g/%g\n", ga->xs, ga->ys);
}

main()
{
   EZP_Image ei;
   EZP_Graph g;
   EZP_Color bgc, fgc, sinc, cosc, tanc, cot;
   EZP_Style s;
   int i;
   int xx = 0;
   EZP_Graph_attrs ga;

   ezp_verbose = 1;

   for (i=0;i<nxy;i++) {
      x[i].i = i;
      ysin[i].f = sin(i*twopi/360.0);
      ycos[i].f = cos(i*twopi/360.0);
   }
   for (i=0;i<ntan;i++) {
      ytan[i].f = tan(i*twopi/360.0);
   }
   for (i=5;i<ntan;i++) {
      ycot[i].f = 1.0/tan(i*twopi/360.0);
   }

   ei = ezp_create_image (900, 500);
   bgc = ezp_allocate_rgbcolor(ei, 255,255,255);
   fgc = ezp_allocate_rgbcolor(ei, 0,0,0);
   sinc = ezp_allocate_rgbcolor(ei, 255,0,0);
   cosc = ezp_allocate_rgbcolor(ei, 0,255,0);
   tanc = ezp_allocate_rgbcolor(ei, 100,100,0);
   cotc = ezp_allocate_rgbcolor(ei, 100, 0, 100);
   ezp_image_title(ei, "Sin, Cos, Tan and Cot", fgc);

   g = ezp_create_graph(ei, EZP_TYPE_INT, EZP_TYPE_FLOAT);
   ezp_graph_captions(g, "degree", "Sin & Cos", fgc);
   s = ezp_create_style(EZP_STYLE_LINE, 5, 5, sinc);
   ezp_plot_xy(g, x, ysin, nxy, s, "Sin");

   s = ezp_create_style(EZP_STYLE_LINE, 5, 5, cosc);
   ezp_plot_xy(g, x, ycos, nxy, s, "Cos");

   gt = ezp_create_graph(ei, EZP_TYPE_INT, EZP_TYPE_FLOAT);
   ezp_graph_captions(gt, "degree", "Tan", fgc);
   s = ezp_create_style(EZP_STYLE_FAT_LINE, 2, 4, tanc);
   ezp_plot_xy(gt, x, ytan, ntan, s, "Tan");

   gc = ezp_create_graph(ei, EZP_TYPE_INT, EZP_TYPE_FLOAT);
   ezp_graph_captions(gc, "degree", "Cot", fgc);
   s = ezp_create_style(EZP_STYLE_FAT_LINE, 2, 4, cotc);
   ezp_plot_xy(gc, x+5, ycot+5, ntan, s, "Cot");

   /* set size and position of the graphs */
   ezp_position_graph(g, 0.0, 0.0, 0.45, 1.0);
   ezp_position_graph(gt, 0.5, 0.0, 0.45, .5);
   ezp_position_graph(gc, 0.5, 0.4, 0.45, .5);

   ezp_save_image(ei,  EZP_IMAGE_JPG, "ezpdemo.jpg");

   ga = ezp_get_graph_attrs(g);
   show_attrs("sin/cos", ga);

   ga = ezp_get_graph_attrs(gt);
   show_attrs("tan", ga);

   ga = ezp_get_graph_attrs(gc);
   show_attrs("cot", ga);
   exit (0);

}
makes this plot
Procedures
- ezp_allocate_color
- ezp_allocate_rbgcolor
- ezp_create_graph
- ezp_create_image
- ezp_create_style
- ezp_get_graph_attrs
- ezp_graph_captions
- ezp_image_title
- ezp_plot_xy
- ezp_position_graph
- ezp_save_image
- ezp_set_graph_label_cb
- ezp_set_graph_pad_flags
- ezp_write_image
Examples
[an error occurred while processing this directive]
|
Jim Fox UW Technology Identity and Access Management University of Washington fox@washington.edu [an error occurred while processing this directive] |