This research was sponsored by the Office of Naval Research.
![]()
INTRODUCTIONThe Shoaling Waves DRI
was a
program sponsored by the Office of Naval Research to investigate the changes that occur
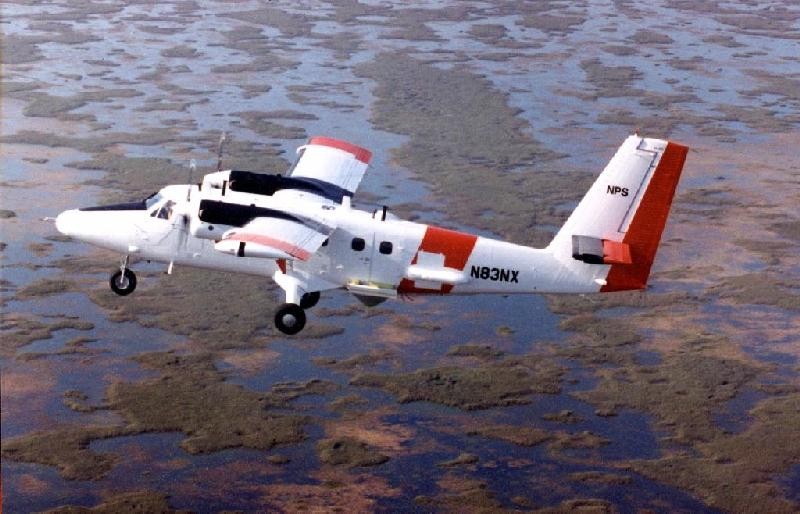
when ocean waves propagate from deep water onto the continental shelf. ROLE OF APL/UWThe Applied Physics Laboratory of the University of Washington collaborated with the NOAA Environmental Technology Laboratory and the Cooperative Institute for Research in Environmental Sciences of Boulder, Colorado to fly a variety of instruments on DeHavilland Twin Otter airplane operated by CIRPAS of Marina, CA.. Bill Plant, Bill Keller, and Ken Hayes of APL/UW constructed a coherent, real-aperture, imaging/rotating radar (CORAR) to fly on the plane. Len Fedor and Vladimir Irisov of CIRES flew three microwave radiometers on the Twin Otter at the same time that APL/UW flew CORAR. These radiometers operated at frequencies of 60, 37, and 23/31 GHz, the 23/31 GHz being a single instrument. CORAR operates in two modes, rotating and fixed, sidelooking. In both modes, cross sections, Doppler offsets, and Doppler bandwidths are collected at multiple range bins during data acquisition. In the rotating mode, the stored cross sections are subsequently averaged over small incidence and azimuth angle bins. This produces mean cross sections as a function of azimuth angle from which wind vectors at 10 meters above the ocean surface can be calculated using a scatterometer model function. In the sidelooking mode, images of both cross sections and Doppler offsets are produced from which directional spectra may be obtained. Spectra of the Doppler offset images can be directly converted to wave height variance directional spectra and their 180o ambiguities can be removed by noting changes in different flight directions. The overall result is that wind vectors and directional ocean wave spectra can be produced simultaneously. In principle, directional wave spectra can also be obtained from Doppler shifts measured in the rotating mode, although we did not succeed in doing this during SHOWEX. Further details about CORAR and the measurements made during SHOWEX that are shown below are given in Plant et.al., 2003 submitted to the Journal of Atmospheric and Oceanic Technology . Figure 1 shows CORAR mounted on the Twin Otter. The gray cylindrical object beneath the fuselage that can be seen just behind the left wheel is the radome for the rotating antennas. The white sidelooking antennas (four feet long) are seen just above the radome directed to the left of the aircraft. The white pod just behind the door of the aircraft houses NOAAs 37 GHz polarimetric radiometer. Another pod with a vertical slot in it can be seen on the end of the wing in the upper photograph. This houses NOAAs scanning 60 GHz radiometer whose purpose is to measure the air/sea temperature difference. NOAA's other radiometer was mounted on the starboard side of the plane.
Figure 1. CORAR and NOAAs radiometers flying on the CIRPAS Twin Otter during SHOWEX. CORAR antennas are directly below the door; the two sidelooking antennas are white while the rotating antennas are inside the conical, grey radome seen below the sidelooking antennas. NOAA's 60 GHz radiometer is seen on the port wing tip and the 37 GHz radiometer is mounted behind the CORAR antennas in the red stripe on the side of the aircraft. NOAA's final radiometer was on the other side of the plane. WIND MEASUREMENTS BY CORARFigure 2 shows neutral wind speeds and directions at a 10 m height obtained from CORARs rotating mode during flights on November 14, 1999. These results were obtained using standard scatterometer techniques by observing the angular dependence and wind speed dependence of the normalized radar cross section of the sea. The model function used to extract winds agreed well with that used to retrieve winds from NASAs NSCAT satellite-borne scatterometer for winds above about 5 m/s. Below that speed, we found that better wind speeds were obtained using measurements we made several years ago on an airship as the model function (Plant et.al., 1998). The reason for the difference between the spaceborne scatterometer model function and the airship data is the greater variability of the wind over the large footprint of the satellite scatterometer than over the small footprint of the airborne system. Details of this phenomenon are given in Plant, JGR, 105, 2000.
Figure 2. Neutral winds at 10 m heights obtained via scatterometry from CORARs rotating mode during SHOWEX. Initial verifications of the winds produced by CORAR were through comparison with nearby buoy wind speeds and directions. Figure 3 shows the degree of agreement achieved. Further comparisons with wind measurements from a variety of other instruments are given later.
Figure 3. Winds from CORAR (asterisks) compared with those from NDBC buoy 44014 (circles) and the ASIS buoy of the University of Miami.
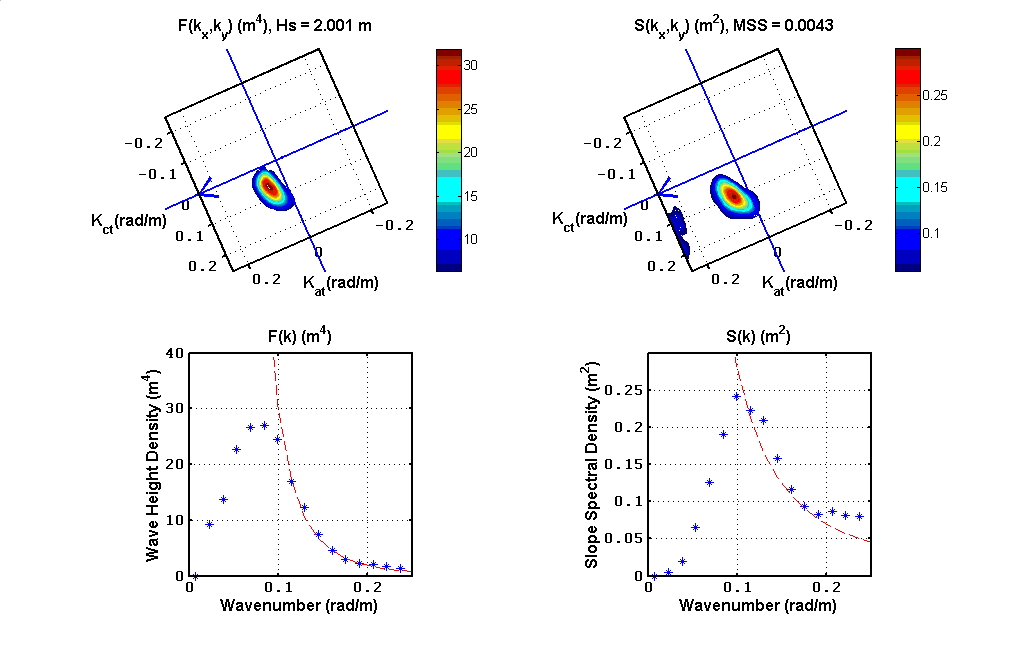
DIRECTIONAL WAVE SPECTRADirectional wave spectra were obtained from CORAR's sidelooking imaging mode during SHOWEX. Examples of the spectra obtained are shown in Figure 4. Dominant wave vectors were determined from these spectra and plotted spatially for comparison with the measured winds. An example is shown in Figure 5.
Figure 4. Wave height and slope spectra measured by CORAR during SHOWEX. Upper plots are directional spectra while the lower ones are the azimuthal integral of the upper ones. The dashed red lines in the lower plots are k-4 for the height spectra and k-2 for the slope spectra.
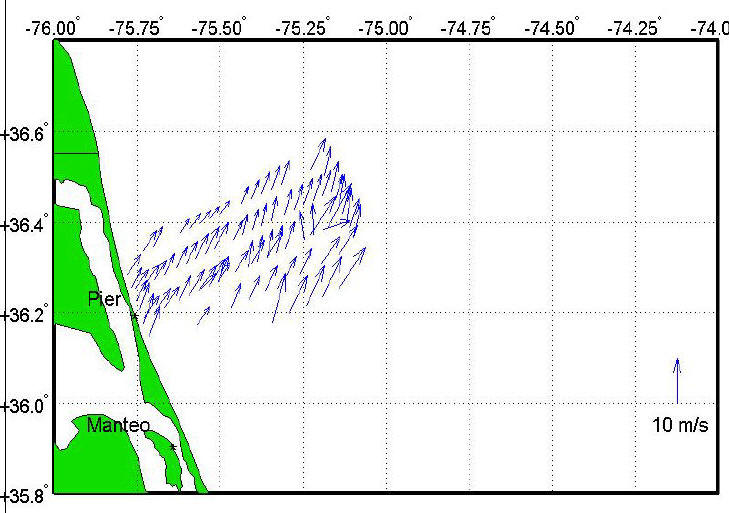
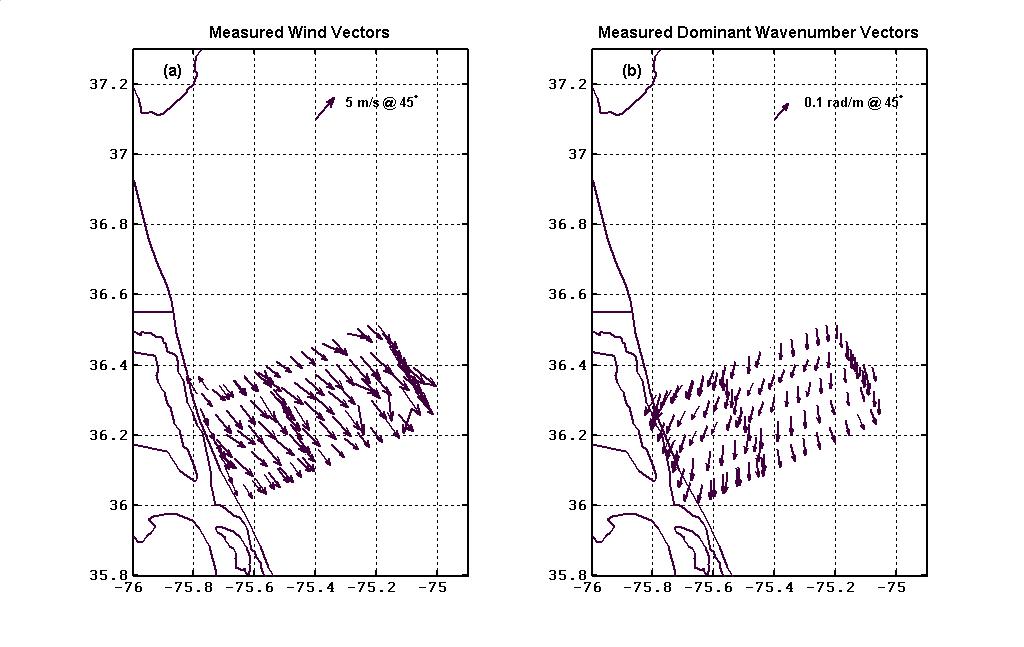
Figure 5. a) Wind vectors and b) Dominant wavenumber vectors measured by CORAR during SHOWEX on November 16, 1999.
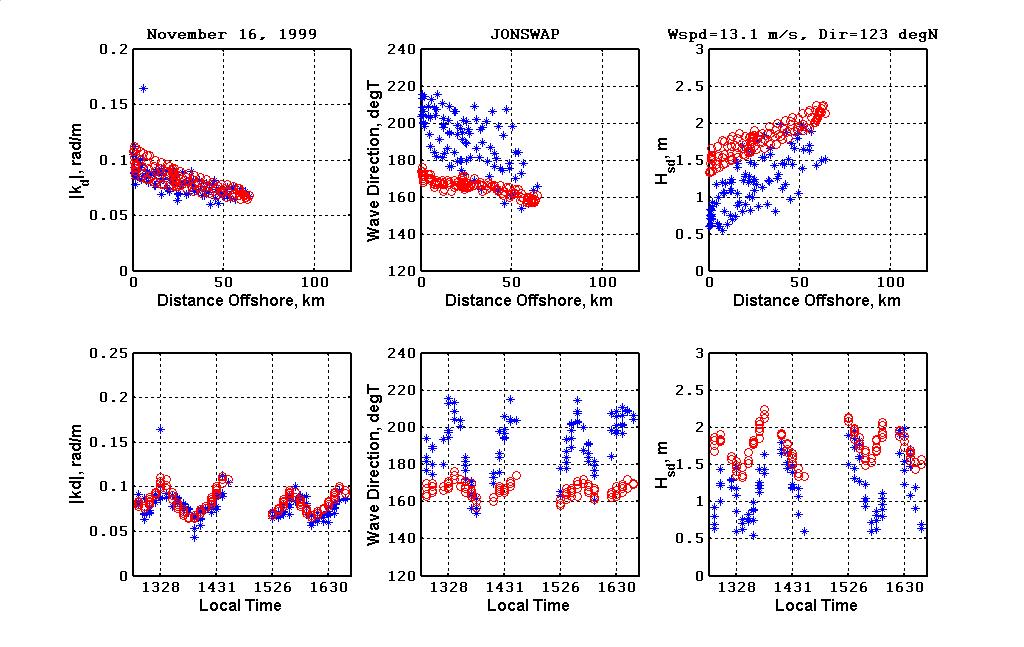
From Figure 5 it is clear that the wind and waves are not in the same direction. The waves are not generated by the local wind. We explored whether the waves could be the result of the wind blowing obliquely offshore to the north of the measurement area. Donelan et.al. Phil.Trans. R.Soc.Lond,315, 1985 showed that under such circumstances, waves are produced at an angle to the wind, like those shown in Figure 5. We found that we were able to fit our data fairly well to this model provided that we used a JONSWAP spectrum for the wave spectrum. Figure 6 shows a comparison of our data to this type of model.
Figure 6. Comparison of wave measurements on November 16, 1999 (red circles) with those expected to be produced by winds blowing obliquely off the Maryland/Virginia coast using the JONSWAP growth parameters (blue asterisks)
More details on this analysis can be found in Plant et.al., 2003.
|