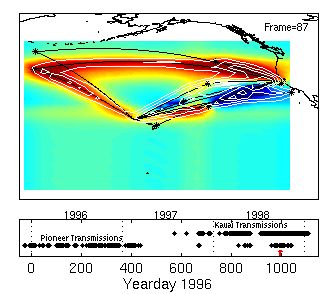
This is a map of 0-1000 m depth-averaged sound speed derived from acoustic data from Pioneer and Kauai transmissions. The colors of the map at left range from dark blue (-0.5 m/s) to dark red (+0.5 m/s). The white contours show the uncertainty map, i.e. the sqrt of the diagonal of the covariance matrix. The lower part of the figure shows the times of the pioneer and kauai acoustic transmissions, with a small red arrow to indicate the time associated with the figure - late 1998 in this case.
Click on the map to view an mpeg movie (1.2 MB) with the sequence of images calculated from the ATOC timeseries obtained during 1996-1998. This movie is best viewed with the framerate set to about 2 frames/sec.
See the Tokyo conference proceeding article for a complete description.
Tokyo acoustic tomography conference proceeding article (1.7 MB *.pdf file)
