POST
Bandwidth testing with Mikrotik SXT2 radios in my office
To support upcoming research on shooting 2.4GHz wifi through the ocean, I purchased a couple of Mikrotik SXTG2HnD. Besides their low cost, these units ticked my boxes: dual-chain, high-power, highly-directional 2.4GHz Wifi access points. And I’m pretty comfortable with the RouterOS. OK, I could have asked for some truly oddball stuff (like a totally illegal 80MHz channel width option for 2.4GHz), but for $160 all-in, they seemed like a great way to get some initial results.
For initial testing, I set them up shooting corner-to-corner in my office. I recognize this is just about the least ideal situation you could imagine, but it lets me mess around with configuration without having to trudge all over creation just to reset the far end.
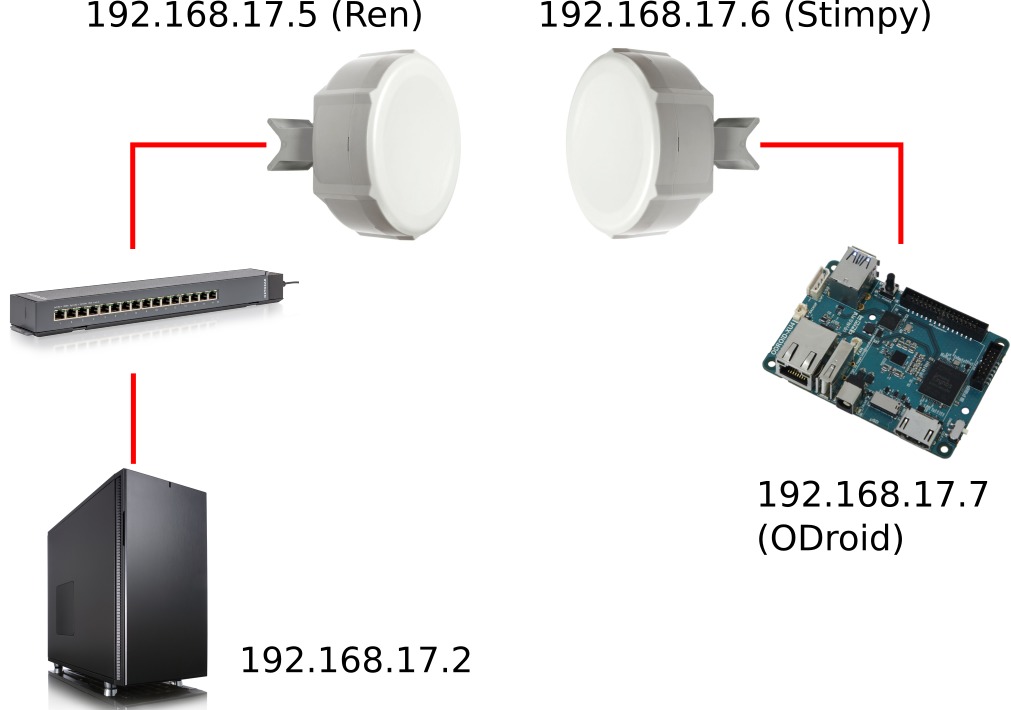
As per my previous post, I’ve built a simple network for testing with iperf3. The remote end (running the server) is a ODroid XU4. This may seem like overkilll, but someday soon I’d like to put the whole remote end in a box and drop it in the ocean. It needs to be able to run off battery power.
The local (iPerf client) end is a desktop. As per before. we have no problem saturating Gigabit with the desktop-ODroid pair on hardlines.

Totally flat network configuration. FWIW, all of my tools and etc. (I don’t claim they’re any good!) are on Github.
I wrote three basic scripts. Two of them are essentially identical, running on the PC and Odroid. Both SSH into the respective SXT to pull down wireless network information. This is logged to file using ts for timestamping.
Right now it streams a single RouterOS command (/interface wireless registration-table print stats without-paging). It would get a little more complicated if I wanted to log multiple commands…
A sample from one of the log files:
Mar 03 13:18:58  0 interface=wlan1 radio-name="6C3B6B59154B" mac-address=6C:3B:6B:59:15:4B
Mar 03 13:18:58    ap=no wds=no bridge=yes rx-rate="6Mbps" tx-rate="300Mbps-40MHz/2S/SGI"
Mar 03 13:18:58    packets=101264,28529 bytes=152247651,1931391 frames=101264,28531
Mar 03 13:18:58    frame-bytes=152451621,1760453 hw-frames=123587,28945
Mar 03 13:18:58    hw-frame-bytes=189152920,2932342 tx-frames-timed-out=0 uptime=3m19s
Mar 03 13:18:58    last-activity=730ms signal-strength=-46dBm@6Mbps signal-to-noise=51dB
Mar 03 13:18:58    signal-strength-ch0=-52dBm signal-strength-ch1=-48dBm
Mar 03 13:18:58    tx-signal-strength-ch0=-48dBm tx-signal-strength-ch1=-44dBm
Mar 03 13:18:58    strength-at-rates=-46dBm@1Mbps 2m51s950ms,-45dBm@2Mbps 2m43s420ms,-
Mar 03 13:18:58                   46dBm@5.5Mbps 2m43s350ms,-45dBm@11Mbps 2m43s310ms,-
Mar 03 13:18:58                   46dBm@6Mbps 730ms,-46dBm@9Mbps 2m43s350ms,-46dBm@12Mbps
Mar 03 13:18:58                   2m43s250ms,-46dBm@18Mbps 2m43s190ms,-46dBm@24Mbps 2m43s130ms,
Mar 03 13:18:58                   -46dBm@36Mbps 2m43s60ms,-46dBm@48Mbps 2m42s940ms,-
Mar 03 13:18:58                   46dBm@54Mbps 2m42s770ms,-46dBm@HT20-0 2m45s490ms,-46dBm@HT20-
Mar 03 13:18:58                   1 2m43s350ms,-46dBm@HT20-2 2m43s270ms,-46dBm@HT20-3
Mar 03 13:18:58                   2m43s210ms,-46dBm@HT20-4 2m43s150ms,-46dBm@HT20-5 2m43s90ms,-
Mar 03 13:18:58                   47dBm@HT20-6 2m42s930ms,-46dBm@HT20-7 2m42s810ms,-48dBm@HT40-
Mar 03 13:18:58                   0 2m43s530ms,-48dBm@HT40-1 2m43s350ms,-48dBm@HT40-2
Mar 03 13:18:58                   2m43s260ms,-48dBm@HT40-3 2m43s210ms,-48dBm@HT40-4 2m43s150ms,
Mar 03 13:18:58                   -48dBm@HT40-5 2m43s80ms,-48dBm@HT40-6 2m40s,-48dBm@HT40-7
Mar 03 13:18:58                   1s940ms
Mar 03 13:18:58    tx-signal-strength=-42dBm tx-ccq=38% rx-ccq=35% p-throughput=241320
Mar 03 13:18:58    distance=53 nstreme=no framing-mode=none routeros-version="6.38.1"
Mar 03 13:18:58    last-ip=192.168.17.6 802.1x-port-enabled=yes authentication-type=wpa2-psk
Mar 03 13:18:58    encryption=aes-ccm group-encryption=aes-ccm management-protection=no
Mar 03 13:18:58    compression=no wmm-enabled=yes
Mar 03 13:18:58    tx-rate-set="CCK:1-11 OFDM:6-54 BW:1x-2x SGI:1x-2x HT:0-15"
I wrote a simple (and actually now that I look at it, really terrible) Ruby script which reformats this as timestamped JSON array:
[{ "date": "Mar 03 13:18:59",    "interface" : "wlan1",
    "radio-name" : "6C3B6B59154B",
    "mac-address" : "6C:3B:6B:59:15:4B",
    "ap" : "no",
    "wds" : "no",
    "bridge" : "yes",
    "rx-rate" : "6Mbps",
    "tx-rate" : "300Mbps-40MHz/2S/SGI",
    "packets" : "101264,28529",
    "bytes" : "152247651,1931391",
    "frames" : "101264,28531",
    "frame-bytes" : "152451621,1760453",
    "hw-frames" : "123587,28945",
    "hw-frame-bytes" : "189152920,2932342",
    "tx-frames-timed-out" : "0",
    "uptime" : "3m19s",
    "last-activity" : "730ms",
    ...
Since all of the files are timestamped (asssuming the system clocks are synchronized, of course), I can just let these two processes run and use the timestamp to extract regions of interest from all three.
I can then run an iPerf test
iperf3 --client 192.168.17.7 -t 600 | ts
which will also get timestamped:
Mar 03 13:28:46 Connecting to host 192.168.17.7, port 5201
Mar 03 13:28:46 [  4] local 192.168.17.2 port 40472 connected to 192.168.17.7 port 5201
Mar 03 13:28:46 [ ID] Interval           Transfer     Bandwidth       Retr  Cwnd
Mar 03 13:28:46 [  4]   0.00-1.00   sec  17.2 MBytes   144 Mbits/sec   54    436 KBytes
Mar 03 13:28:46 [  4]   1.00-2.00   sec  16.2 MBytes   136 Mbits/sec    2    249 KBytes
Mar 03 13:28:46 [  4]   2.00-3.00   sec  15.0 MBytes   126 Mbits/sec    0    293 KBytes
Mar 03 13:28:46 [  4]   3.00-4.00   sec  15.0 MBytes   126 Mbits/sec    0    329 KBytes
Mar 03 13:28:46 [  4]   4.00-5.00   sec  15.0 MBytes   126 Mbits/sec    3    256 KBytes
Mar 03 13:28:46 [  4]   5.00-6.00   sec  13.8 MBytes   115 Mbits/sec    0    301 KBytes
Mar 03 13:28:46 [  4]   6.00-7.00   sec  12.5 MBytes   105 Mbits/sec    2    250 KBytes
...
Unfortunately, iPerf buffers output to the console (apparently), but with a little (again, terribly ugly) Ruby magic, I get a CSV file showing timestamp, bandwidth (Mbit/sec) and retries:
2017-03-03 13:27:56,144.000000,54
2017-03-03 13:27:57,136.000000,2
2017-03-03 13:27:58,126.000000,0
2017-03-03 13:27:59,126.000000,0
2017-03-03 13:28:00,126.000000,3
2017-03-03 13:28:01,115.000000,0
...
Now wait, you’re saying. JSON and CSV! I wrote the CSV one first and I can’t be bothered to change it. And the Mikrotik format is simply not going to convert to CSV without cherry-picking out the columns I want.
Now I can load these into a Jupyter notebook and analyze. Whew.
Right now the analysis is all totally manual, but good for exploration. I’m running a 10 minute TCP test PC->Odroid.
Here are some preliminary results.
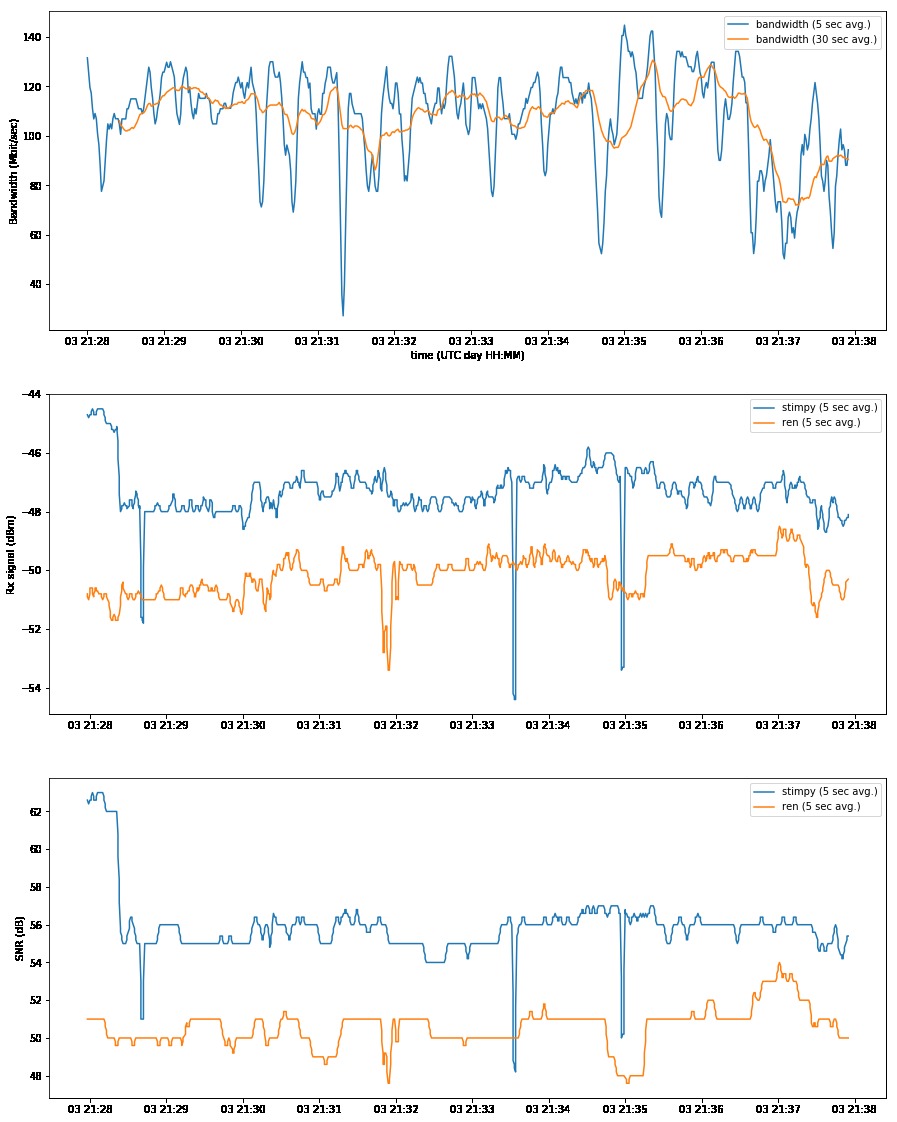
Top plot is bandwidth averaged over 5 and 30 second moving windows. Second plot is received signal strength at each end averaged over the two chains with a 5-second moving window, and third plot is SNR at each end (with a 5-second moving window). Since the bulk of the transport is from Ren->Stimpy, the Stimpy plots should be more important (I think?), but since it’s TCP, bidirectional throughput is still critical.

Over the ten minutes, the average payload bandwidth was 107 Mbit/sec out of a theoretical channel max of 300Mbit/sec and a realistic bandwidth max of about 200 Mbit/set.
This is pretty non-ideal circumstances. The distances is too short for these high power transceivers (both have been dialed back to 0dBm tx power), and as this is a campus environment, the spectrum is extremely congested.
Update
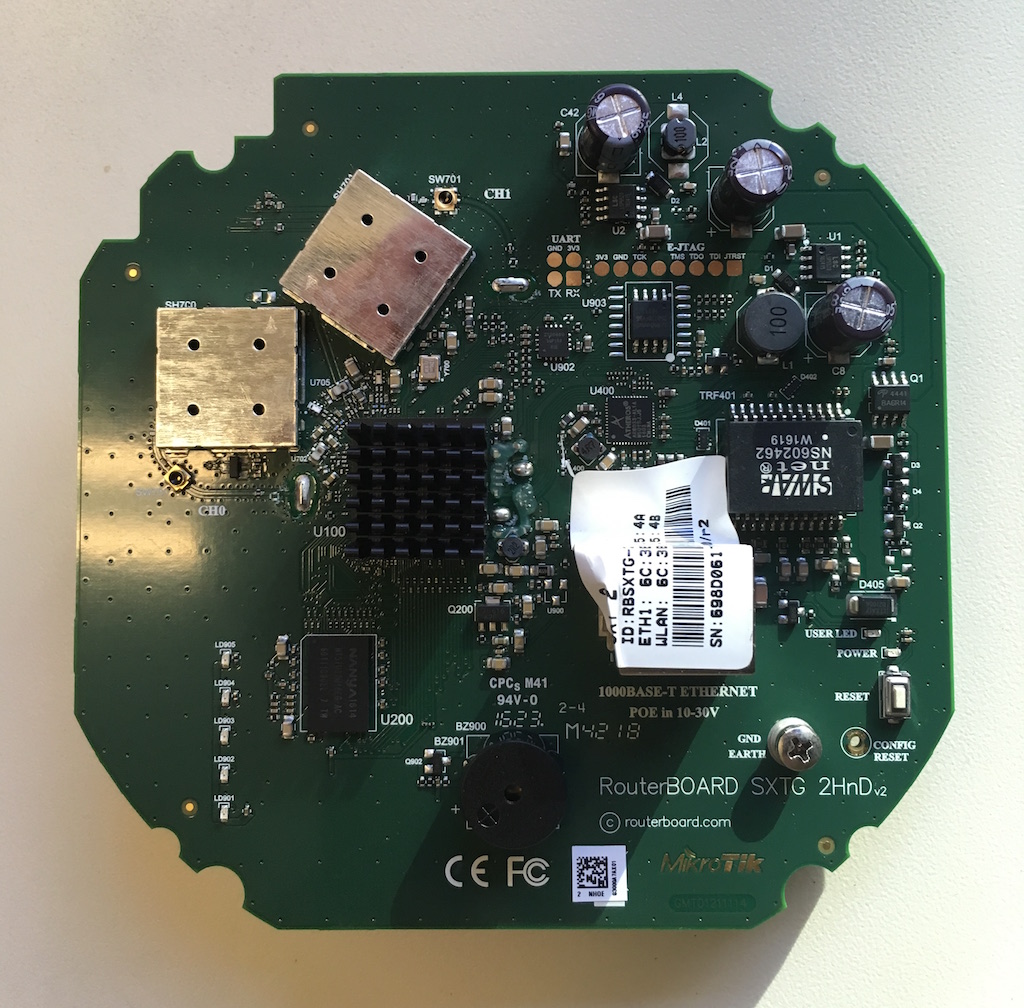
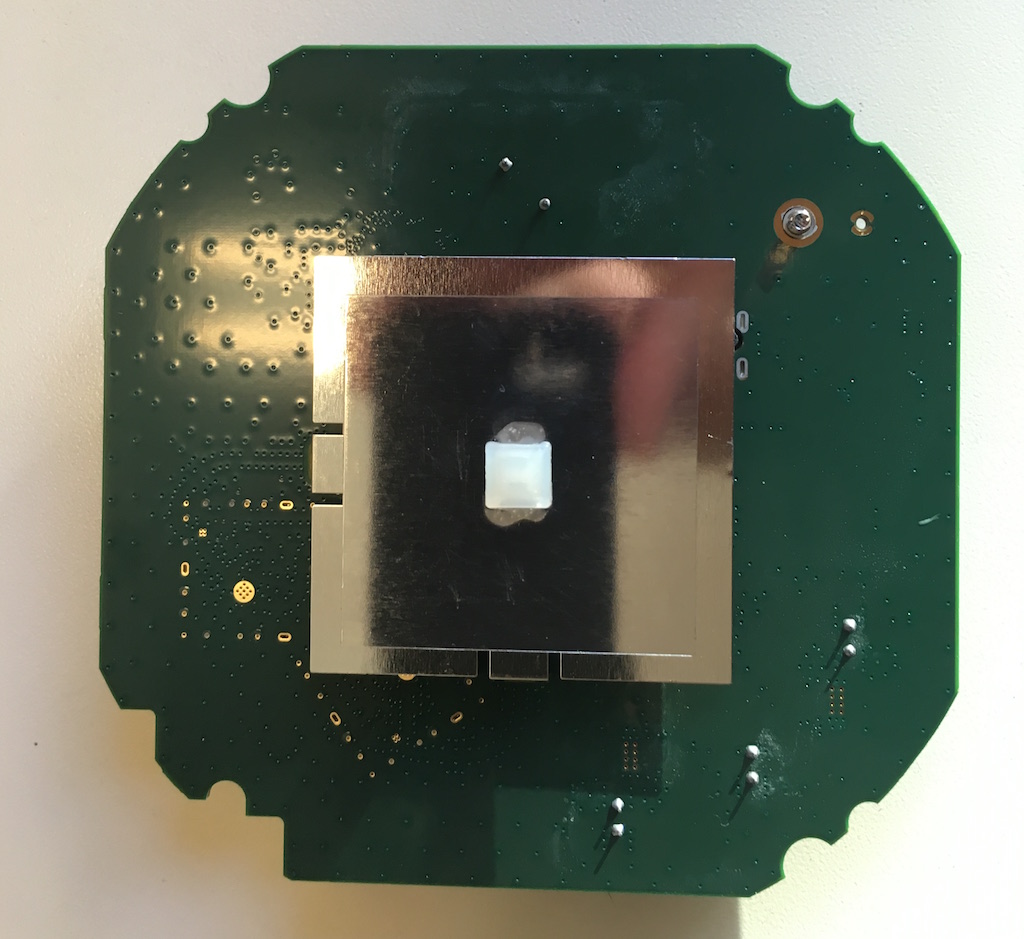
I decided to void the warranty on one of the SXT’s to see what was inside.
The circuit board inside is about 114 x 116mm.

