This web site contains:
1) the full article from AJNR 20, 1393-1398, 1999 and
2) extra figures and text after the published article relating to Functional MR spectroscopic imaging.
3)Information on reading and writing interventions: The Process Assessment of the Learner (PAL) Guides for Reading and Writing Interventions was written for psychologists, teachers, and parents. It summarizes the University of Washington Learning Disabilities Center research on assessment and intervention for reading and writing disabilities. It can be ordered at 1-800-211-8378.
.
Dyslexic Children Have Abnormal Brain Lactate
Response to Reading-related Language Tasks
Todd L. Richards, Stephen R. Dager, David Corina, Sandra Serafini, Aaron C. Heide, Keith Steury, Wayne Strauss, Cecil E. Hayes, Robert D. Abbott, Suzanne Craft, Dennis Shaw, Stefan Posse, Virginia W. Berninger
Source:
Richards et al, American Journal of Neuroradiology, 20, 1393-1398, September, 1999
From the Departments Radiology (T.L.R., S.R.D, A.C.H., C.E.H. D.S.), Psychiatry and Behavioral Science (S.R.D., S.C.), Psychology (D.C., K.S.), Speech and Hearing Sciences (S.S.), Bioengineering (T.L.R., S.R.D., W.S.), College of Education (R.D.A., V.W.B.), University of Washington, Seattle; Geriatric Research Education and Clinical Center, Veterans Affairs Puget Sound, Seattle (S.C.); and Institut fur Medicine, Forschungszentrum, Julich GmbH, D-52425, Germany (S.P.).
Grant support: This work was funded by a special multidisciplinary learning disabilities Center Grant from NIH (NICHD), P50 HD33812.
Presentation at meeting: This paper was presented in part to the Cognitive Neuroscience Society 1998 Annual Meeting, see Poster 67 , Tuesday 4/7/98.
Corresponding author: Todd L. Richards, Radiology Department, Box 357115, University of Washington, Seattle, Wa. 98195 USA e-mail address: toddr@u.washington.edu
Phone: 206-548-6725 Fax: 206-543-3495
Abstract
Background and Purpose: Children with dyslexia have difficulty learning to recognize written words due to subtle deficits in oral language related to processing sounds and accessing words automatically. The purpose of this study was to compare regional changes in brain lactate between dyslexic children and control children (age- and IQ-matched children who are good readers, ages 9-12, all right handed boys) during oral language activation .
Methods: Brain lactate metabolism was measured during four different cognitive tasks (3 language tasks and 1 non-language task) in dyslexic boys(n=6) and in control boys(n=7) using a fast magnetic resonance spectroscopic imaging, proton echo-planar spectroscopic imaging (1 cm3 voxel resolution). The area under the N-acetyl aspartate(NAA) and lactate peaks was measured to calculate the lactate/NAA ratio in each voxel.
Results: Dyslexic boys showed a greater area of brain lactate elevation (2.33+SE 0.843 voxels) compared to the control group (0.57+SE 0.30 voxels) during a phonological task in the left anterior quadrant (ANOVA, p=.05). No significance differences were observed in non-language tasks.
Conclusion: Dylexic and control children differ in brain lactate metabolism when performing language tasks, but do not differ in nonlanguage auditory tasks.
Introduction
Dyslexia, or specific reading disability, is the most frequently occurring learning disability and the most common disorder of childhood. Estimated to affect 5 - 15% of children, dyslexia is unexpected underachievement in reading for one's intellectual ability. It has been well-established that it is a language-based disorder, often caused by deficits in phonological processing (1-4). Although dyslexia is a genetic disorder (5) with reported linkage to chromosomes 6 and 15 (6, 7) its phenotypic expression (8) depends on the environment as well as heredity (9, 10). Twenty years of behavioral evidence support two major causal mechanisms in dyslexia: i) deficient phonological processing of spoken words (1-4) and ii) inability to visually access names in the lexicon (mental dictionary) automatically (11, 12). The consequence of these deficiencies is poor reading which differs from good reading in verbal efficiency (4). Several investigations have found associations between neurophysiologic abnormalities and dyslexia (13-17). Functional neuroimaging studies with PET ([18F]fluorodeoxyglucose) indicate that adult dyslexics have focal increases in glucose metabolism (13, 14) suggesting either inefficient processing or the activation of compensatory pathways (15).
Based on what is known about the metabolic role of lactate and glucose during brain activation, we hypothesized that brain functional inefficiencies would exist in dyslexics, specifically manifested as elevated lactate covering a greater area of the brain during language activation and processing. Lactate is known to be metabolized in the brain as a neuronal substrate (18) and also as a by-product for glucose metabolism during brain activation. MR spectroscopy has previously been used to demonstrate lactate activation (increase in lactate) in normal adults during visual, auditory, and cognitive tasks (19-23). In these studies, lactate was observed to increase rapidly during sensory stimulation in a regionally -specific manner.
We used a novel non-invasive technique called "proton echo-planar spectroscopic imaging" (PEPSI) (24) to investigate metabolic brain activation during oral language tasks in dyslexic and control children. Previous neuroimaging studies of language have used either positron emission tomography (PET) (25) or functional magnetic resonance imaging (fMRI) (26) that utilizes blood oxygenation level-dependent (BOLD, an indirect measure of metabolism) image contrast changes to map out regional brain activation. Functional MR spectroscopy (fMRS) using the PEPSI technique is an alternative approach for detecting regional brain activation and measures tissue-based lactate changes (a direct measure of metabolism) produced by a temporary mismatch of oxygen delivery and consumption in response to neuronal activation (27). For this study, we specifically tested the hypothesis that a greater area of brain activation (higher voxel counts) would occur with language processing in dyslexic children compared to controls.
Materials and Methods
Study Design
Six dyslexic and seven non-dyslexic (controls) boys were imaged using PEPSI (24) while performing four different cognitive tasks. The dyslexic and control groups were well-matched in age, IQ, and in head-size (number of total voxels) but not in reading skills where they demonstrated marked differences, as described below. The experimental tasks were designed to activate phonological and lexical access functions of the brain, while a tone task was used to activate auditory non-language functions of the brain. Scanner noise and passive listening (to word lists used in both the phonological and lexical access tasks) were two control tasks used to subtract out low-level acoustic and non-specific stimulus effects, respectively. The phonological and lexical access tasks engage additional linguistic processes beyond that required for passive listening of language. The unique brain activation due to processing rhymes or accessing word meanings, independent of brain activation due to the characteristics of word stimuli, was assessed by subtracting out the passive listening condition from the phonological and lexical access tasks. The component of brain activation related to processing requirements for auditory functions not specific to language was assessed by subtracting out the scanner noise from the tone judgments.
Magnetic Resonance Imaging and Spectroscopy
Conventional MRI and PEPSI were performed on a clinical 1.5 Tesla Signa MR imaging system from General Electric equipped with version 5.4 software and a custom-built radiofrequency coil developed by Hayes et al. (28) MR images were acquired in the sagittal plane (TR/TE 600/20 msec) and also in the axial plane (TR/TE1/TE2 2000/35/80 msec). The custom designed coil was necessary to acquire MR spectroscopic data with high enough signal-to-noise ratio to detect the small lactate peak. The coordinates of the Sylvian fissure and surrounding language-related structures were determined from the sagittal and axial images and used to determine the axial slice for spectroscopic imaging. The areas sampled with PEPSI were based on the work of Ojemann et al. (29) that invasively demonstrated language activation in the anatomic region encompassing the Sylvian fissure and adjacent opercula. Deeper subcortical structures were also included that are associated (through neuronal connectivity) with the cortical areas. Proton spectra were acquired using PEPSI, a spin-echo pulse sequence developed by Posse et al. (24) that allows fast spectroscopic imaging which is 32 time faster than conventional hydrogen spectroscopic imaging for the same spatial resolution. Parameters for data acquisition included: TR 4000 msec; TE 272 msec; 2 averages; 32 x 16 spatial matrix; 512 echoes in the echo-planar acquisition; 32 complex points per echo; full echo acquisition; field of view 24 cm; and slice thickness 20 mm. Spatial resolution was approximately 1 cm3. Data were processed as described previously (23). The metabolites were integrated using the following procedure: 1) magnetic field inhomogeneity shifts (B0 shifts) were corrected by finding the maximum point of the NAA peak and resetting the ppm scale to 2.0 ppm for each spectrum; 2) the average baseline was determined from 32 points to the right of 0.0 ppm; 3) the maximum intensity point of the peak was determined within a set spectral range ( NAA = 2.0 +/- 0.07, lactate = 1.3 +/- 0.1 ppm); and 4) integration was performed by summing the spectral intensities for the NAA and lactate for the ppm ranges specified in step 3.
Subject Characterization
The University of Washington Human Subjects Institutional Review Board approval was obtained for this study, and each subject (as well as parent/guardian) gave written, informed consent. All subjects were right handed (90-100% on the Edinburgh Handedness scale(30)). The control boys had a history of learning to read easily and were reading above normal for age (average was one standard deviation above mean for age using the Woodcock Reading Mastery Test-Revised (31)) . The dyslexic boys had a developmental history of extreme difficulty in learning to read despite many forms of extra assistance at school and also had a family history of multi-generational dyslexia, which was confirmed in a concurrent family genetics study (W. Raskind, personal communication) at our center. The dyslexic boys were reading on average 1.66 standard deviations below the mean for age using the Woodcock test (31). In addition, all the dyslexic boys were shown to have a triple deficit in three skills that predict ease of learning to read and response to intervention, phonological (phoneme segmentation and/or memory for spoken nonwords), rapid automatized naming, and orthographic (speed of coding written words and/or accuracy of representing them in memory)(32) . Based on independent t-tests, the 7 controls ( M=127.3, SD=10.8) and 6 dyslexics (M=124.3, SD=11.1) did not differ in age in months (t(11) = 0.49,p=0.637). Likewise, the controls (M=15.6, SD=3.2) and dyslexics (M=13.2, SD=1.6) did not differ in age-corrected WISC-III vocabulary scores (t (11)= 1.68, p=0.12), which provide the best estimate of Full Scale IQ. However, the controls and dyslexics did differ significantly in age-corrected standard scores for reading real words on the Word Identification (WI) subtest of the Woodcock Reading Mastery Test-Revised (WRMT-R) and for reading pseudowords on the Word Attack (WA) subtest of the WRMT-R: t(11)=6.81, p < 0.001 on the WI subtest and t(10) = 6.02, p<0.001 on the WA subtest. The differences for both real word reading (WI, controls, M=115.1, SD=9.2; dyslexics, M=75.5, SD=11.8) and pseudoword reading (WA, controls, M=110.2, SD=6.8; dyslexics, M=79.0, SD=10.7) were large as well as statistically significant.
Language Tasks
During MR scanning, the children were asked to listen to aurally-presented words, non-words, and tone pairs at a rate of one stimulus pair every 4 sec. Language stimuli were composed of four groupings of word pairs, crossed for lexical status (word vs. non-word) and sound similarity (rhyming vs. non-rhyming) resulting in four sets of stimuli: word/word:nonrhyming (e.g. FLY-CHURCH); word/word:rhyming (FLY-EYE), word/nonword:nonrhyming (CROW-TREEL); word/non-word:rhyming (MEAL-TREEL). Nonwords such as TREEL allow assessment of sound processing without any meaning cues. The presenting order of word pair-types were counterbalanced and thus the ordering effects were controlled for. During rhyming (phonological task), subjects listened to the same stimulus material and judged whether the word pairs rhymed or did not rhyme; whether words were real was irrelevant. During the lexical access condition, subjects listened to the word pairs, and judged whether the word pairs contained two real words, or contained a non-word; whether or not the words rhymed was irrelevant. Thus same stimulus lists were used for lexical access and rhyming, only the task instructions were changed. Subjects indicated their rhyme and lexical decisions by raising cards held in the right and left hands (the hand used to signal a "yes" response was counterbalanced across subjects). During passive listening, subjects listened to the same stimuli, but were instructed to alternately raise the left and right hand without making any judgments on the stimuli. For the tone judgment task, five pure tones (329.6hz, 350hz, 415.3hz, 440hz, & 523hz), were grouped into pairs of identical tones, or different tones. Subjects were asked to raise one hand if the tones were identical and to raise the opposite hand if the tones were different. The subjects were tested for accuracy of their responses for all tasks during a prescan training session and during the actual MR scanning. For the tone subtraction, the baseline scanner noise was used instead of passive listening. A recovery period of 5 minutes between tasks was based in part on the lactate recovery measurements by Frahm et al (27).
Data Analysis
To affirmatively evaluate focal brain activation, z-score maps were created from the lactate/NAA ratios based on the following equation:
[lactate/NAA (task) - lactate/NAA (passive listening)] / [standard deviation of lactate/NAA (passive listening)],
where (task) in the above equation refers to the task given during the scan which was either phonological, lexical access, or tone differentiation. The standard deviation of the lactate/NAA was calculated for each subject using all valid spectra of the control task (either passive listening or scanner noise). This z-score was calculated for all voxels that contained valid spectra for each language condition.(23). Definition of lactate elevation was based on z-scores greater than 2.0 on a voxel by voxel basis. The number of voxels with elevated lactate within each quadrant was counted for each subject.
The PEPSI data were analyzed to count the number of voxels (computerized volume elements) with elevated lactate in four regions of the brain . Because regional specificity of lactate response is not well established and also because of the large variability between subjects in the spatial location of the lactate response, we divided the spectroscopic imaging slice into four quadrants. The brain was divided into four quadrants based on 1) left to right -- brain midline defined on the axial MRI and 2) anterior to posterior -- using the midpoint of the thalamus as a landmark. Inferential statistics were used to compare relative activation for each group in each brain quadrant on each task. ANOVA was used to test for differences in the number of activated voxels between controls and dyslexics. The number of valid voxels for the dyslexic group was not significantly different from that of the control group (controls, M=160.6, SD=6.9; dyslexics, M=166, SD=19, t (11) = 0.76, p<.48).
The lactate/NAA ratio was used in order to normalize for radiofrequency inhomogeneity, variable cerebrospinal fluid contribution, and also to standardize the lactate signal across subjects. An automated computer-software mask was applied to the spectra to ensure that the MR lactate signal was not contaminated with scalp lipid signal (23). A true lactate peak was differentiated from lipid contamination based on MR frequency which was determined from an in vitro lactate measurement (the lipid peak MR frequency was not the same as lactate frequency). Additionally, in previous work, we varied the TE to assess J-coupling properties of the peak at 1.3 ppm which identified this peak to be lactate (33).
Results
Dyslexic boys had significantly more brain voxels with elevated MR lactate levels (2.33 +/-SE 0.843) compared to a control group (0.57 +/- SE 0.30) during a phonological task in the left anterior quadrant (ANOVA, F(1,11)= 4.41, p=.05, see Figs.1 and 2). None of the other quadrants were significantly different in comparing dyslexics with controls for the other 3 quadrant during the phonological task (p values ranged from .62 to .74), for the lexical access task (p values ranged from .37 to .96), for the tone task (p values ranged from .32 to .92), or for the scanner noise alone (p values ranged from .23 to .99). The fact that there was no difference between the dyslexic subjects and controls during the tone task implies that the difference between dyslexics and controls is specific to auditory language function and not to non-linguistic auditory function. Behavioral data during scan sessions demonstrated that: i) all subjects performed the tasks above chance levels showing attentiveness to the task and ii) the dyslexics had a significantly lower correct response rate in responding to phonological tasks compared to controls (dyslexics M= 89.6 SD= 3.9; control M= 96.7 SD = 2.9; t(10)=3.78, p<.004). Behavioral differences between the dyslexics and controls during the tone task, however, were not statistically significant (t(10)=1.7, p=0.12).
Discussion
Our main finding was that the dyslexic children in comparison to non-impaired children had a larger regional distribution of metabolic activation, characterized by the number of voxels with elevated lactate, in the left anterior quadrant during the phonological task. This greater regional activation cannot be directly attributed to the dyslexics' reading difficulty because the tasks were auditory and did not involved reading per se. Concurrently collected behavioral data verified that the subjects were attentively listening to the auditory stimuli and also demonstrated that the dyslexic children were less accurate than the control children for the phonological task. Our findings suggest that the dyslexic brain has a larger regional distribution of metabolic activation (as evidenced by the increased number of voxels with elevated lactate) compared to normal brain during the mental process of accomplishing the same linguistic task (although the dyslexics made more linguistic errors). This metabolic abnormality points toward a phonological processing problem located in the left anterior quadrant (this quadrant included the left frontal lobe and language areas surrounding the Sylvian fissure). This increased metabolic energy demand may be the neurological substrate underlying the behavorial phenomenon described by the verbal efficiency theory(4). According to this theory, poor readers must exert more mental effort (because of inefficient language processing) than good readers to accomplish the same task. Further work will be required to determine whether the greater activation reflects inefficient processing within language areas or the activation of compensatory pathways (i.e., a functional brain pathway outside the normal brain activation region that was established to compensate for dyslexic deficits).
Increases in the MR lactate signal have been observed in the occipital cortex during photic stimulation (20, 21) in the auditory cortex during 1-kHz tone pulses (34), in the basal ganglia during finger movements (35), and in the limbic region of brain during seizure activity (36). The increase in lactate is thought to be related to an increase in glucose metabolism during neuronal stimulation.
Recent studies using fMRI by Shaywitz et al (16) have also shown that adult dyslexic subjects exhibited different brain activation patterns compared to nonimpaired subjects during a phonological language task compared with an orthographic coding task. Shaywitz et al found significant overactivation in the left inferior frontal gyrus (See Figure 2 from Shaywitz) in the dyslexics subjects compared to controls (16). These findings for adults are consistent (although more anatomically localized) with our findings for children because we also found regional metabolic overactivation compared with controls in the left anterior quadrant which included the left inferior frontal gyrus. Using PET ([18F]fluorodeoxyglucose, Hagman et al. (13) found higher metabolism in the medial temporal lobe bilaterally in adult dyslexics during an auditory syllable discrimination task. Fluorodeoxyglucose and lactate are both involved in carbohydrate metabolism of the brain and both are involved in energy metabolsim during neuronal activation. Rumsey et al. (37) have found that the left inferior frontal cortex is involved in phonological processing using 15O PET to measure blood flow. One difference between our results and prior studies mentioned above is that the pattern of metabolic activation that we observed with lactate included subcortical areas as well as cortical areas (cortical activation areas are reported by the PET and fMRI studies). The subcortical activation areas that we observed may reflect neuronal connectivity from the adjacent cortical areas involved with language.
Our findings are important because they shed new light on brain mechanisms involved with dyslexia at a developmental stage when dyslexia is amenable to treatment (9, 38). Because most children respond positively to instructional interventions, many educators have rejected the notion that reading problems are brain-based. Functional brain differences between dyslexics and controls such as those demonstrated by this study add evidence that dyslexia is a brain-based disorder. We have shown that there is a difference in the regional distribution of lactate elevation between dyslexics and controls; however, it is premature to use this technique as a diagnostic tool for dyslexia.
Conclusions
We have established that there are differences in the regional distribution of brain lactate metabolism between dyslexic and control children, matched on age, IQ, and head size, for an aurally-presented phonological task. Our work extends previous work that found differences in patterns of cerebral blood flow between adult dyslexics and controls in visually-presented fMRI reading tasks (16) and in phonological and orthographic tasks during PET scanning (17).
Acknowledgments. We gratefully acknowledge contributions from Darrrell Hochman and Martin Kuschmerick to this manuscipt, and editorial assistance from Jane Johnson.
Figure Legends:
Figure 1 - Three bar graphs of number of activated voxels (as defined by MRS lactate increases) in the four quadrants of the brain for both dyslexic and control children. a, graph of phonological task data; b, graph of lexical access data; and c, graph of tone task data. Error bars are standard error of the mean. The * asterick indicates dyslexic versus control comparisons that were significantly different.
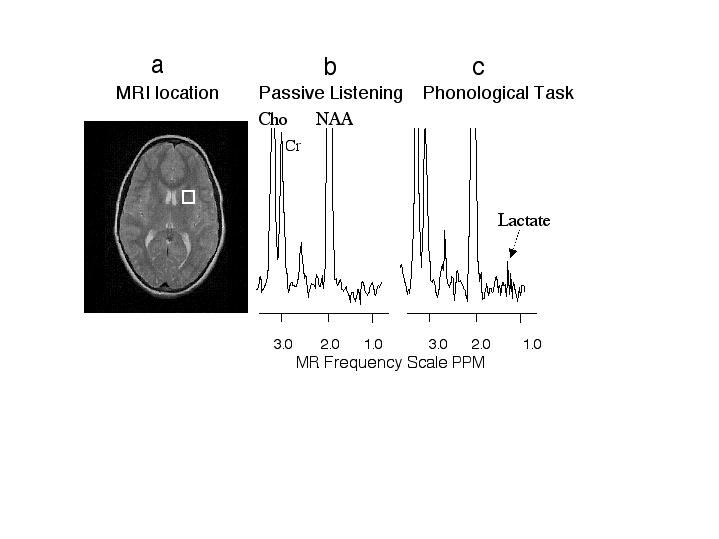
Figure 2 - MR image and proton spectra from an activated brain region of one dyslexic subject.
a, MR image with white box indicating the brain region measured with MR spectroscopy. b, proton MR spectrum from the white box brain region during the passive listening task. c, proton MR spectrum from the white box brain region during the phonological task. The intensity axis of the spectra is scaled so that the lactate can be easier visualized; however, Cho and NAA are scaled off the figure. Notice the increase in the lactate peaks during the phonological task compared with passive listening. Abbreviations: Cho - choline, CR - creatine, NAA - N-acetyl aspartate.
References
1. Liberman I, Shankweiler D, Fisher F, and Carter B. Explicit syllable and phoneme segmentation in the young child. J Exp Child Psych 1974; 18:201-212
2. Bradley L and Bryant P. Categorizing sounds and learning to read--A causal connection. Nature 1983; 301:419-421
3. Wagner R and Toregsen J. The nature of phonological processing and its causal role in the acquisition of reading skills. Pysch Bull 1987; 101:192-212
4. Perfetti C. Reading Ability, New York: Oxford University Press. 1985
5. DeFries J, Fulker D, and LaBuda M. Evidence for a genetic aetiology in reading disability of twins. Nature 1987; 329:537-539
6. Cardon L, Smith S, Fulker D, Kimberling W, Pennington B, and DeFries J. Quantitative trait locus for reading disability on chromosome 6. Science 1994; 266:276-279
7. Grigorenko E, Wood F, Meyer M, et al. Susceptibility loci for distinct components of developmental dyslexia and chromosomes 6 and 15. American Journal of Human Genetics 1997; 60:27-39
8. Berninger V, Abbott R, Thomson J, and Raskind W. Phenotype for reading and writing disability: A life span approach. Submitted 1998
9. Berninger V. Reading and writing acquisition. A developmental neuropsychological perspective, Madison, WI: Brown & Benchmark. 1994
10. Olson R, Forsberg H, and Wise B. Genes, environment, and the development of orthographic skills. In: V.W. Berninger, eds. The varieties of orthographic knowledge I: Theoretical and developmental issues. Dordrcht, The Netherlands: Kluwer Academic Publishers. 1994:27-71
11. Denckla M and Rudel R. Rapid 'automatized' naming (R.A.N.): Dyslexia differentiated from other learning disabilities. Neuropsych 1976; 14:471-479
12. Wolf M, Bally H, and Morris R. Automaticity, retrieval processes, and reading: A longitudinal study in average and impaired reading. Child Develop 1986; 57:988-1000
13. Hagman JO, Wood F, Buchsbaum MS, Tallal P, Flowers L, and Katz W. Cerebral brain metabolism in adult dyslexic subjects assessed with positron emission tomography during performance of an auditory task. Arch Neurol 1992; 49:734-9
14. Gross-Glenn K, Duara R, Barker WW, et al. Positron emission tomographic studies during serial word-reading by normal and dyslexic adults. J Clin Exp Neuropsychol 1991; 13:531-44
15. Rumsey JM. Neuroimaging in developmental dyslexia:. In: G.R. Lyon and J.M. Rumsey, eds. Neuroimaging: A Window to the Neurological Foundations of Learning and Behavior in Children. Baltimore: Brookes. 1996:57-77
16. Shaywitz SE, Shaywitz BA, Pugh KR, et al. Functional disruption in the organization of the brain for reading in dyslexia. Proc Nat Acad Sci 1998; 95:2636-2641
17. Rumsey JM, Nace K, Donohue B, Wise D, Maisog JM, and Andreason P. A positron emission tomographic study of impaired word recognition and phonological processing in dyslexic men. Arch Neurol 1997; 54:562-73
18. Tsacopoulos M and Magistretti PJ. Metabolic coupling between glia and neurons. J Neurosci 1996; 16:877-85
19. Frahm J, Kruger G, Merboldt KD, and Kleinschmidt A. Dynamic uncoupling and recoupling of perfusion and oxidative metabolism during focal brain activation in man. Magn Reson Med 1996; 35:143-8
20. Prichard J, Rothman D, Novotny E, et al. Lactate rise detected by H-1 NMR in human visual cortex during physiologic stimulation. Proc Natl Acad Sci 1992; 88:5829-5831
21. Sappey-Marinier D, Calabrese G, Fein G, Hugg JW, Biggins C, and Weiner MW. Effect of photic stimulation on human visual cortex lactate and phosphates using 1H and 31P magnetic resonance spectroscopy. J Cereb Blood Flow Metab 1992; 12:584-92
22. Richards TL, Gates GA, Gardner JC, et al. Functional MR spectroscopy of the auditory cortex in healthy subjects and patients with sudden hearing loss. Ajnr Am J Neuroradiol 1997; 18:611-20
23. Richards TL, Dager SR, Panagiotides HS, et al. Functional MR Spectroscopy During Language Activation, a preliminary study using proton echo-planar spectroscopic imaging (PEPSI). Int J Neurorad 1997; 3:490-495
24. Posse S, Dager SR, Richards TL, et al. In Vivo Measurement of Regional Brain Metabolic Response to Hyperventilation using Magnetic Resonance Proton Echo Planar Spectroscopic Imaging (PEPSI). Mag Res Med 1997; 37:858-865
25. Eulitz C, Elbert T, Bartenstein P, Weiller C, Muller SP, and Pantev C. Comparison of magnetic and metabolic brain activity during a verb generation task. Neuroreport 1994; 6:97-100
26. Binder JR, Frost JA, Hammeke TA, Cox RW, Rao SM, and Prieto T. Human brain language areas identified by functional magnetic resonance imaging. J Neurosci 1997; 17:353-362
27. Frahm J, Krueger G, Merboldt KD, and Kleinschmidt A. Dynamic NMR studies of perfusion and oxidative metabolism during focal brain activation. Adv Exp Med Biol 1997; 413:195-203
28. Hayes CE and Mathis CM. Improved brain coil for fMRI and high resolution imaging, Fourth Annual Meeting of the Society of Magnetic Resonance, Berkeley. 1996
29. Ojemann G. Localization of language in frontal cortex. Adv Neurol 1992; 57:361-8
30. Oldfield RC. The assessment and analysis of handedness: The Edinburgh Inventory. Neuropsychologia 1971; 9:97-113
31. Woodcock R. Woodcock reading mastery test - revised, Minnesota MN: American Guidance Service. 1987
32. Berninger V. Process Assessment of the Learner: Guides for Intervention, San Antonio, TX: The Psychological Corporation. 1998
33. Dager SR, Marro KI, Peterson J, and Richards TL. Applications of Magnetic Resonance Spectroscopy to Investigate Panic Disorder. In: H. Nasrallah and J. Pettegrew, eds. NMR Spectroscopy in Psychiatric Brain Disorders. Washington DC: American Psychiatric Press, Inc. 1995:147-177
34. Singh M. Toward proton MR spectroscopic imaging of stimulated brain function. IEEE Trans Nuc Sci 1992; 39:1161-1164
35. Kuwabara T, Watanabe H, Tsuji S, and Yuasa T. Lactate rise in the basal ganglia accompanying finger movements: a localized 1H-MRS study. Brain Res 1995; 670:326-328
36. Prichard JW. Nuclear magnetic resonance spectroscopy of seizure states. Epilepsia 1994; 35 Suppl 6:S14-20
37. Rumsey JM, Horwitz B, Donohue BC, Nace K, Maisog JM, and Andreason P. Phonological and orthographic components of word recognition. A PET-rCBF study. Brain 1997; 120:739-759
38. Lovett M, Ransby M, Hardwick N, Johns M, and Donaldson S. Can dyslexia be treated? Treatment specific and generalized treatment effects in dyslexic children's response to remediation. Brain and Language 1989; 37:90-121
Figure 1 A
Figure 1 B
Figure 1C
Figure 2
______________________________________________________________________________________________
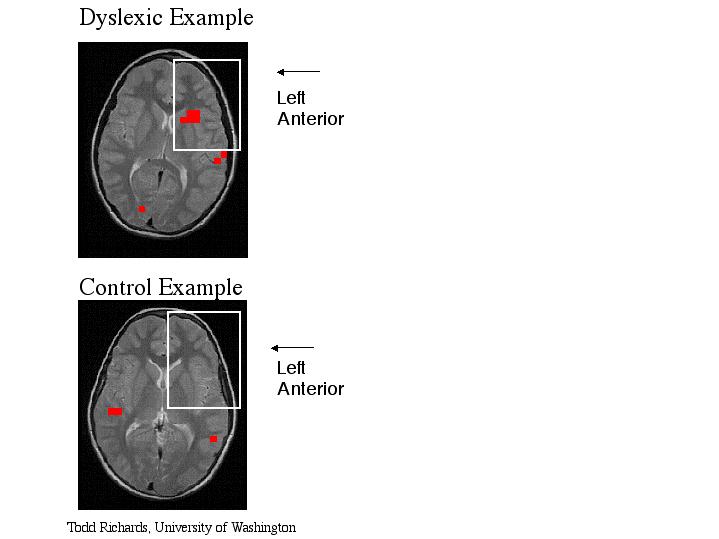
Extra Figure (not shown in publication) - Functional MR spectroscopic overlays onto magnetic resonance images during a phonological task. Each red box represents one brain activation voxel from one subject in which brain activation was defined as MR lactate signal which was two standard deviation above the average lactate. The image functional overlay on the bottom is from one "normal" volunteer. The image functional overlay on the top is from one dyslexic subject. The subject's left side is on the image right side (radiological convention). Notice the dyslexic subject has large activation in the left anterior region of the brain
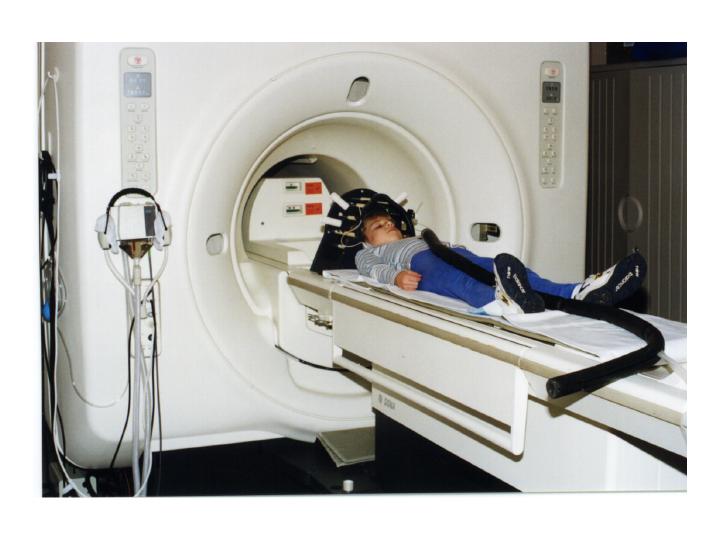
This is a photograph of a child in the radiofrequency head coil developed by Dr. Cecil Hayes. This detector allows us to measure spectroscopic imaging signals with at least 30% better signal-to-noise than the conventional head coil. The earphones (developed by Sandra Serafini) are used to deliver the language stimuli to the subject during the scanning procedures and these earphones do not interfere with the magnetic resonance signal. (Photograph by Alicia W. Richards)
Photograph of a child preparing for a functional MR spectroscopic imaging scan (with the PEPSI technique). The child is near the bore of the General Electric Signa magnet which operates at 1.5 Tesla. The earphone connection is also visible (black tubing).
.