Slide #5 (a chart)
Chart Image: Bar chart showing quarterly earnings for four quarters by region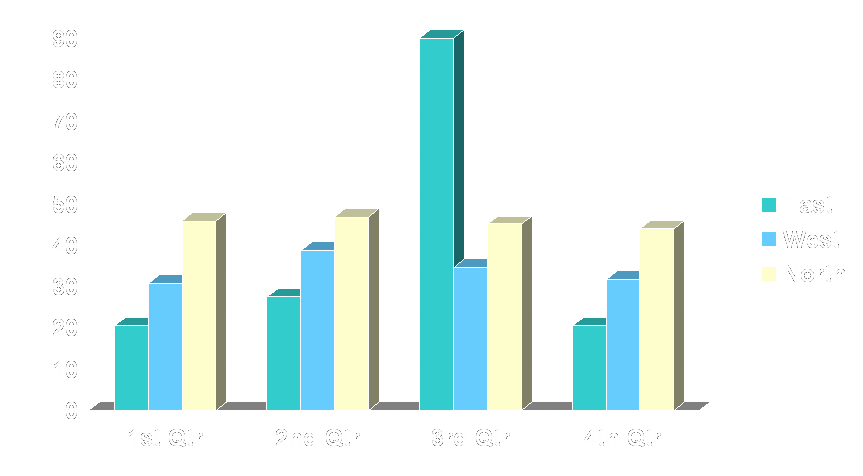
Summary: Over the last four quarters, the north region consistently sold 45 units each quarter. The west region sold 30 units in the first quarter, followed by 38, 34, and 31 in subsequent quarters. The east region saw a dramatic spike in sales during Quarter 3. Its sales from 1st through 4th quarter were 20, 28, 90, and 20 units.
| 1st Qtr | 2nd Qtr | 3rd Qtr | 4th Qtr | |
|---|---|---|---|---|
| East | 20.4 | 27.4 | 90 | 20.4 |
| West | 30.6 | 38.6 | 34.6 | 31.6 |
| North | 45.9 | 46.9 | 45 | 43.9 |