Skip to content
Help
PowerPoint & Friends: Accessible Slides on the Web
Previous
|
Next
Table of Contents
PowerPoint & Friends
Accessible Slides on the Web
Slide #1 (a numbered list)
Slide #2 (bulleted lists in columns)
Slide #3 (an image)
Slide #4 (a table)
Slide #5 (a chart)
Slide #6 (an org chart)
Slide #7 (a cycle diagram)
Slide #8 (list of links)
Text and Images from Slide
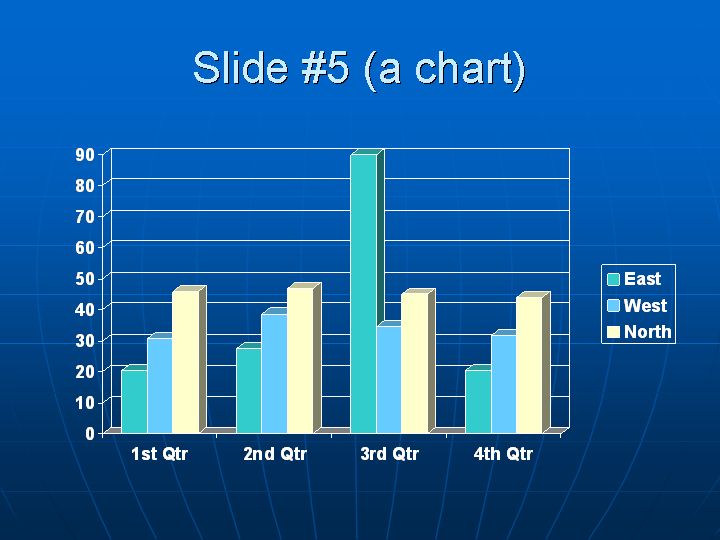
Slide #5 (a chart)
Sales Growth by Quarter and by Region
1st Qtr
2nd Qtr
3rd Qtr
4th Qtr
East
20.4
27.4
90
20.4
West
30.6
38.6
34.6
31.6
North
45.9
46.9
45
43.9
View all slides
|
Contents of this slide