Research on Web Accessibility in Higher Education
Table of Contents
- Research on Accessibility of Higher Education Websites
- These slides are online:
- Partners
- NSF Regional Alliances
- Objective 1
- Objective 2
- Objective 3
- Benefits
- Investing in America's Future
- Ways to Collaborate With Us
- Examples of Articles in the KB
- Two Research Projects
- Research Project #1
- A Global Benchmark
- Method
- Method (continued)
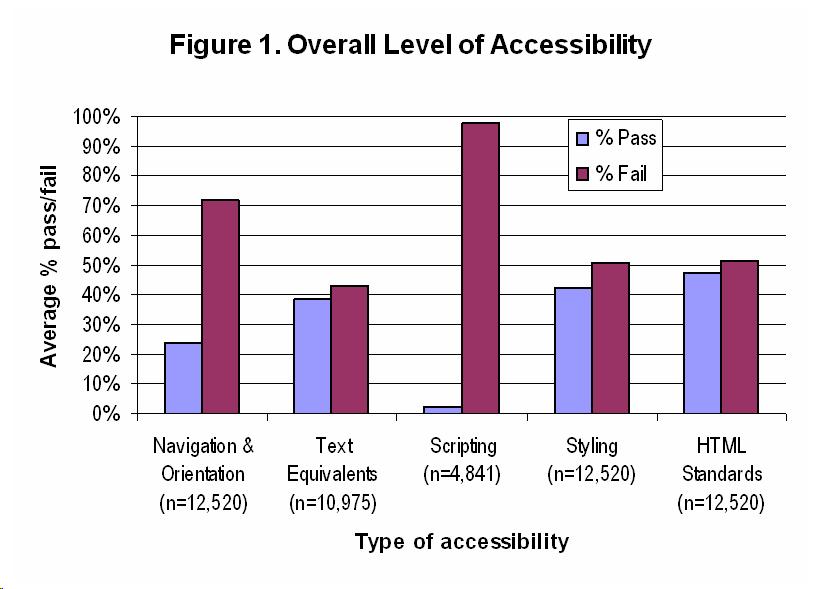
- Results
- Cluster Analysis
- The Top Ten (in alphabetical order)
- The Top Ten (continued, in alphabetical order)
- Research Project #2
- Five Research Questions
- Five Research Questions (cont.)
- Five Research Questions (cont.)
- The Sample
- The Websites
- The Websites (cont.)
- The Checkpoints
- The Checkpoints (cont.)
- Three Assessments
- Three Groups
- Timeline
- How were letters received?
- And the second letter?
- Third letter and mini-assessment
- Research Question #1
- Mean scores on a 1-3 scale
- Mean scores (cont.)
- Research Question #2
- Results by Carnegie
- Results by Carnegie (cont.)
- Research Question #3
- Results: Alt text on images
- Research Question #4
- Confounding Variables
- Significant Overall Change
- Effect of Outreach
- Effect of Outreach (cont.)
- Research Question #5
- Responses to recommended change
- Implications
- Implications (continued)
- Web Accessibility CBI
- AccessComputing
Text and Images from Slide
Results

