Java Argus Argus Detail Pane Extended Info Set Preferences Alert Pane Help Contents Help Detail Config Ops View
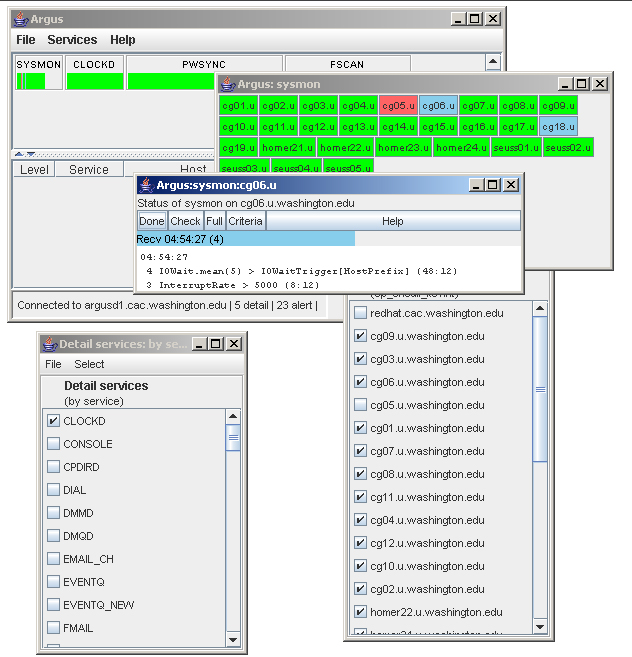
This just has a slightly more interesting error. A service called sysmon has found two problems - the IO Wait (averaged over 5 minutes) is too high, and the instantaneous Interrupt Rate is too high. This has triggered a level 4 alert.
Note the buttons marked 'Done', 'Check', 'Full', and 'Criteria'. All services have 'Done' (don't show me the error again), 'Check' (run the test again right now), and 'Help'. The other buttons vary by service, and cause a two way conversation between the dashboard and the monitoring agent. In this case, the sysadmin might want to know what the other performance numbers on the box looked like, and could click 'Full' to see them. 'Criteria' would list what the assorted trigger levels are.