Vehicle Distribution in Large Personal Rapid Transit Systems
This paper was originally published in the Transportation Research Record, No. 1451, pp 95-99, 1994, Transportation Research Board, Washington, D.C. It contains two illustrations that are not included in this on-line version
Abstract
Point-synchronous control for large personal rapid transit (PRT) systems that offers a possibility of increasing the link capacity for empty vehicles is described. Two different principles for the redistribution of empty vehicles are outlined. Depots for empty vehicles are introduced so that the passenger stations can be kept smaller. The methods were developed and tested on the basis of a simulation model for PRT systems. The model includes facilities for ride sharing and a number of control options.
The described methods have been evaluated on tentative PRT networks for Gävle and Gothenburg, Sweden. The Gothenburg network has 654 stations, 4,200 links, and 12,800 vehicles. Simulation results indicate that point-synchronous control performs better than synchronous control, close spacing of empty vehicles can increase link capacity by up to 80 percent, depots can reduce station sizes to one-third and reduce call time to one-third, and waiting times are the same with or without depots.
INTRODUCTION
A personal rapid transit (PRT) system provides on-demand transport for individual passengers or small parties. The service is direct between off-line stations in a network of tracks and switches. The travel demand is generally unbalanced, particularly in the peak hours, with some stations serving mainly as origins and others mainly as destinations. Hence empty vehicles end up where they are not needed, with growing deficits at other stations. In a large network with long-distance commuting the task of balancing supply and demand of empty vehicles constitutes a major problem.
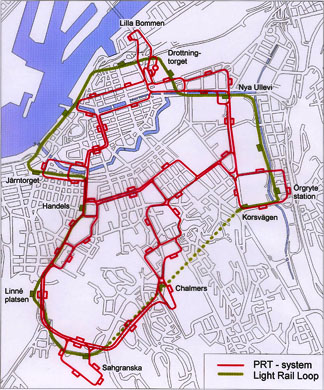
In a PRT system with high demand link capacity is a limiting factor and over half of the vehicle flow on many links may be empty vehicles. The time to call an empty vehicle may be very long. It is therefore necessary to call vehicles before they are needed on the basis of the predicted supply and demand at each station. With random passenger arrivals and large call times vehicle buffers at stations would need to be quite large. Such large stations would be difficult to place in the city structure. This paper describes methods for empty vehicle management first in systems in which stations are used as sole vehicle buffers and second in systems with separate depots for empty vehicles. So-called point-synchronous control is described. Point-synchronous control allows different speeds for and closer spacing of empty vehicles. A simulation model was used to develop and evaluate various control ideas. The conclusions are based on simulation results for a large tentative PRT network for the city of Gothenburg, Sweden. An illustration of the PRT network designed for the central area of Gothenburg is provided. It is only a part of the larger city-wide network used in this study.
POINT-SYNCHRONOUS CONTROL
Simulation models have been developed for synchronous control and what is called point-synchronous control. In synchronous control all vehicles move synchronously over the network and no vehicle is allowed to depart from a station before a free slot is available all the way to the destination. With point-synchronous control a vehicle starts as soon as the exit is free and then modifies its path and speed as it goes along. A vehicle books its passage through the next node and then controls its speed on the basis of the remaining time and distance to its booked passage time. Point-synchronous control resembles pedestrians approaching a self-revolving door. Booking points on two incoming links are located at equal distances to the merge point. The synchronization in each node ensures that conflicts are avoided and that the node capacity is used to its maximum. Bookings and route choices are made successively and locally on the basis of the momentary situation. The control is decentralized to each vehicle and its next downstream node. Point- synchronous control allows for different speeds on different links, different speeds for different vehicles, and different slot frequencies for different nodes. Point-synchronous control can also be viewed as a method of realizing collision avoidance in an asynchronous control system, ensuring synchronism at merge points.
PRT SIMULATION MODEL
Simulation models have been developed both for synchronous control and for point-synchronous control. The latter model is described here. A description of synchronous simulation has been provided elsewhere (2). The purpose of the models is to evaluate alternative PRT networks for given demand matrices and to study alternative control principles. Passenger groups are generated randomly, with exponential intervals and group size being either fixed (typically 1.25 persons) or random, with probability "p" of group size n. Passengers inter-changing from route services (buses or trams) can be generated in bursts at fixed intervals. Origins and destinations of trips are drawn from given matrices of probabilities.
Passengers may be matched for ride sharing in various ways as discussed in the paper by Blide (this Record). Passengers are placed in queues at the departure station in the best direction of departure (stations on double-track sections). Each vehicle is traced through the system as time is incremented in steps equal to the time slot between node passages (typically 1.6 sec). It gets successive slot allocations for passing each node and is given route directions on the basis of the quickest path in each diverge as described below. Simulations start with vehicles distributed over stations according to expected demand. An initial period (typically 30 min) is simulated before statistics are collected.
The model has been programmed in Simula on a Macintosh computer. Graphics and animations are available.
POINT-SYNCHRONOUS VERSUS SYNCHRONOUS CONTROL IN GÄVLE
The same PRT network for the city of Gävle (91 stations, 372 links, and 1,350 vehicles) was simulated both with synchronous control and with point-synchronous control. The Gävle studies have been summarized previously (1). Further studies are being done for the system in Gävle to (a) recommend stages of implementation, (b) outline architectural design and integration into the street environment, and (c) analyze the socioeconomic costs and benefits of the possible implementation of a PRT system.
Simulation results reported previously (2) and summarized in Table 1 indicate that point-synchronous control performs better than synchronous control in all respects studied.
TABLE 1: Performance of Different Control Systems
Synchronous Control Point-Synchronous Vehicle fleet needed 1346 vehicles -4% Waiting time 2.2 minutes -14% Riding time 11.5 minutes -2% Maximum link flow 1700 vehicles/hour +30% An important additional advantage of point-synchronous control is its robustness toward disturbances. A vehicle breakdown in a synchronous system would affect the overall plan, and each vehicle would have to be rescheduled. In a point-synchronous system all control is local and can immediately adapt to the new situation. A blocked link would cause the nearest upstream diverge to send all vehicles the other way. Diverges farther back would change their directions as soon as the path tables were recalculated.
CHOICE OF ROUTES
Each vehicle carries its destination and transmits that to the next downstream diverge controller. Each diverge controller keeps a table of the shortest running times to each destination. The diverge controller checks the latest observed running times to the following diverges downstream (left and right), adds the remaining running times (from tables) to the desired destination, picks the shortest alternative unless it is blocked, and transmits a left or right back to the vehicle. The tables of running times are recomputed regularly and are based on statistics on link times including delays. A modifies forward label correction method building the shortest path tree between non-station diverges was used. Recalculation of all 2 million paths in Gothenburg by this method takes 160 sec on a Powerbook 170 (25 MHz).
PLATOONING OF EMPTY VEHICLES
Empty vehicles do not need a safety distance between them. They can be allowed to pick up on each other to form platoons so that several empty vehicles can pass through a node in the same time slot. This will increase the capacity of the system. Safety distances need to be ensured before and after loaded vehicles only. It is advantageous if empty vehicles group together, and the weaving algorithms are made to do that.
With 16-m slots (1.6 sec at 10 m/sec) and 3.5-m vehicles it possible to pack four empty vehicles into the same slot. The theoretical link capacity increases from 2,250 to 9,000 vehicles/hr if all vehicles are empty. In simulations with a mix of loaded and empty vehicles, link flows of more than 4,000 vehicles/hr (+80 percent) with a time slot of 1.6 sec have been observed.
With the link capacity increased by platooning the average simulated delays owing to congestion were reduced from 0.9 to 0.6 min per passenger trip ( -30 percent).
WEAVING EMPTY VEHICLES IN MERGES
A weaving algorithm for merges has been designed to serve two purposes: (a) to maximize node capacity by weaving empty vehicles together and (b) to avoid queues spilling back past the up-stream node, hindering flows in other directions.
In each merge and in each time step a vehicle is selected for passage by the following algorithm (selecting the first alternative whose condition is fulfilled):
1. If the outgoing link has no free space then the merge is blocked,
2. If one incoming link is empty then choose the other,
3. If one incoming vehicle has not arrived then choose the other link,
4. If the previous vehicle was loaded or both incoming vehicles are loaded then choose the link with the least free space behind the incoming queue (to avoid spillback of queues),
5. If the next vehicle on the link from where the previous (empty) vehicle came is also empty then choose that vehicle, or
6. Otherwise take the empty vehicle from the opposite incoming link (and add an extra space for weaving)
Weaving of empty vehicles and avoiding of queue spillback are important for the overall network capacity.
REDISTRIBUTION BETWEEN STATIONS
Various procedures for the redistribution of empty vehicles between passenger stations have been evaluated by simulations. They are based on predicted demand at each station and actual as well as predicted supply (including vehicles scheduled to arrive). Vehicles are called when the supply falls below a call level and are sent off when the supply exceeds a (higher) send level. These levels are individual for each station and are calculated from the travel demand matrix. Currently the following procedure is used:
1. For each station (and direction) the number of vehicles needed per minute is determined from the travel demand matrix. For stations with ride sharing (high demand) the vehicle need is reduced. The required fleet is calculated as the vehicles needed at stations to cover the demand during a given number of minutes (8 to 30 min depending on the average trip time).
2. Vehicles are initially placed at each station in proportion to its demand. The call level is specified as a fraction of the initial supply (typically about one-third).
3. As passengers are ready to depart from a station with a vehicle supply below the call level, an empty vehicle is called from the nearest station with a surplus (over its call level).
4. For each station a supply forecast is maintained:
-Supply forecast = vehicles at the station + vehicles on their way in.
-When a station gets overfilled it sends off a vehicle to the station with the lowest forecast supply in relation to its call level.
DEPOTS FOR EMPTY VEHICLES
Special parking areas for empty vehicles—so-called depots— have been introduced into the network so that the station buffers can be made smaller.
The distribution and redistribution of empty vehicles with depots have been made as follows:
1. The vehicle demand is calculated in the same way as it is without depots.
2. Vehicles are placed at each single station to cover the need only during the time it takes to bring an empty vehicle from the nearest depot. This initial supply is also the call level for that station. Remaining vehicle need for each station is placed at the nearest depot. The call level of a depot is specified as a fraction of its initial supply.
3. As passengers are ready to depart from a station with a vehicle supply below the call level an empty vehicle is called from the nearest depot.
4. For each depot a supply forecast is maintained:
-Supply forecast = vehicles at the depot — unserved calls out + vehicles on their way in.
-When a station gets overfilled it sends off a vehicle to the depot with the lowest forecast supply in relation to its call level. When a depot gets empty or the supply forecast falls below the call level then it calls a vehicle from the nearest other depot with a surplus (forecast exceeding the call level).
With the introduction of depots in the Gothenburg network the average call time for empty vehicles was reduced from 14 to 5 minutes. Waiting times for passengers remained the same (average 1.3 min). Empty running mileage increased by 23 percent, so that the fraction of the fleet running empty at any time went up from 27 to 34 percent. Station sizes could be significantly reduced. Without depots the 90th percentile of station sizes was 21 vehicle berths. With depots the same percentile went down to six vehicle berths. The average depot has room for 250 vehicles, which is needed to park 88 percent of the fleet at night. The remaining 12 percent of the fleet is parked at stations. During the peak half-hour 6 percent of the fleet is at stations and 22 percent is at depots, totaling 28 percent standing vehicles.
APPLICATION FOR GOTHENBURG
A tentative PRT network (654 single stations and 4,200 links) has been designed to cover the needs for the entire city of Gothenburg. Into that network were introduced 45 depots for empty vehicles. The number of depots and their locations were not optimized. They were placed where space was thought to be available, with the objective of developing and testing the principle of depot management.
The results discussed in this paper are from a case with about 12,800 vehicles providing about 60,000 passenger trips in the peak hour (600,000 trips per day). Ride sharing is assumed between trips from the same origin going in the same direction (up to 3 min of waiting, two intermediate stops, and 30 percent detour for any passenger). Table 2 is a summary from one of the runs. The PRT study for Gothenburg is now focusing on a smaller network for the central city. That network has about 30 km of track and 42 stations and is planned to supplement existing bus and tram routes.
Table 2: Excerpt from Output of Gothenburg Simulation
Summary: Gothenburg PRT Network, version 4.1, 7:30-8:00 am 716 track kms 654 single stations 1396 diverges and equally many merges 12795 cabs 1.6 secs slot interval 10 m/sec normal speed 20 for loading and acceleration 2 pass/min at stations for sharing; max 3.0 min wait 30 % acceptable detour for sharing; max 2 intermediate stops 30 initial minutes without statistics 30 minutes in study period 27,191 passengers departed in study period 23 % of stations have ride-sharing with 65% of passengers 57 % matched departing share stations, = 37% of all 1.3 minutes waiting for cab, max 18.6, 99% < 3.0 11.0 minutes riding, max 51.4 0.6 mins congestion and stopping delay, max 6.3 6.3 kilometers average trip, max 30.2 34 kilometers/h average speed 6.6 minutes per empty trip, max 34.8 4.2 kilometers per empty trip, max 22.0 12.8 minutes call time 1.76 passengers per loaded cab 4.3 passengers departed per cab hour 2.1 loaded cabs departed per cab hour 39 % of cabs running with passengers 27 % of cabs running empty 34 % of cabs waiting at stations or depots 507 cabs/hour on average link, max 2849 467 passengers/hour on average link, max 3556 64,131 vehicle kilometers empty 85,240 vehicle kilometers with passengers 150,320
passenger kilometers CONCLUSIONS
• Point-synchronous control performs better than synchronous control.
• Closer spacing of empty vehicles can increase link capacity by up to 80 percent.
• Depots can reduce station size to one-third and reduce call time to one-third.
• Waiting times are the same with or without depots.
ACKNOWLEDGMENTS
The simulation model for synchronous control was developed with funding from the Swedish Transport and Communication Research Board, which also funded the applications for Gävle. The model for point-synchronous control and the applications for Gothenburg were funded by the Gothenburg Traffic Office. The PRT networks for Gothenburg were designed under the leadership of Bo Blide, project manager for the Gothenburg PRT study.
REFERENCES
1. Andréasson, Ingmar, Simulation Studies of PRT Systems, Report DNR 90-291-732, Swedish Transport and Communications Research Board
2. Andréasson, Ingmar, Simulation of Large PRT Systems for Swedish Cities, Proceedings, 3rd ASCE Conference for APMs, 1993.
Last modified: February 20, 2010