Graphs to show trends in use of WordPress on the
UA 'depts' and 'courses' Web servers and use of the Streaming service
The graphs below present system log data, graphed to try to demonstrate
usage trends. These may be helpful to measure ...
Note about WordPress source data: they are taken from a sum of activity as
shown in Apache log data from all of the 'depts' (3) and 'courses' (2)
Web servers. (more details below.)
Graphs show daily counts of:
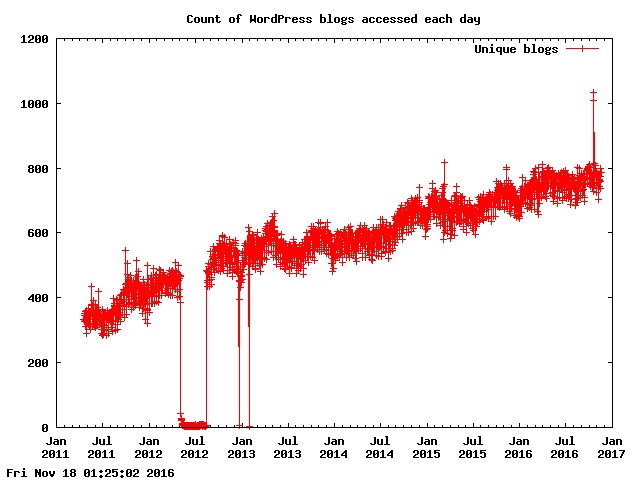
- How many UA WordPress blogs are accessed each day?
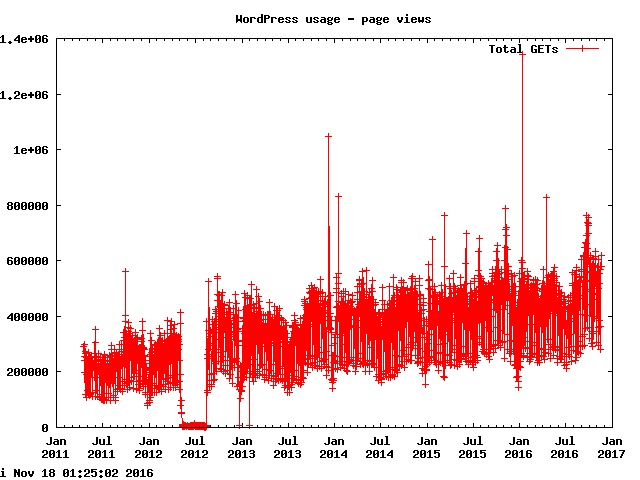
- A measure of overall WordPress usage
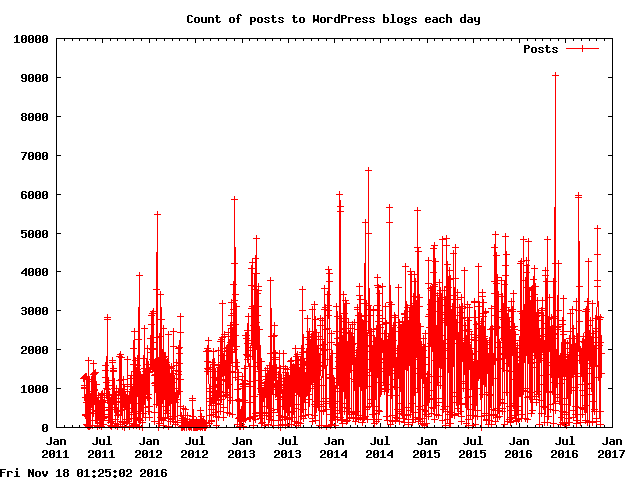
- How many posts are there to blogs each day?
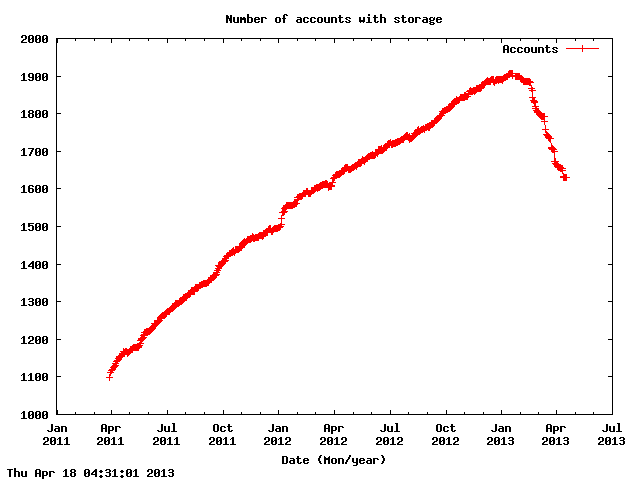
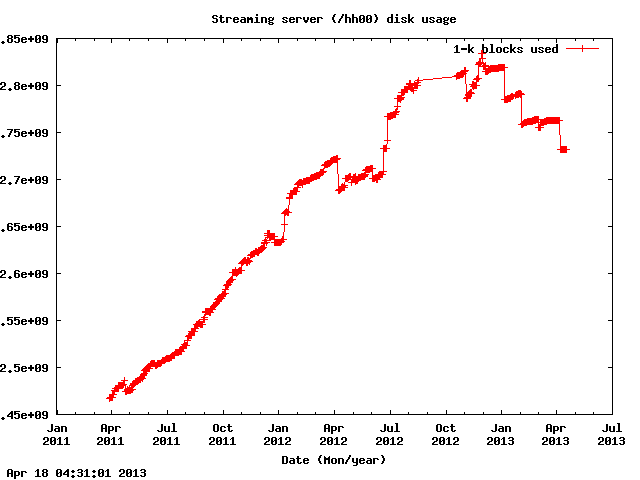
- How many accounts use the UA Streaming server disk storage?
- How much disk space are Streaming accounts using?
How many unique WordPress instances are accessed each day?
What is the overall usage level of WordPress?
How many posts were made to WordPress blogs today?
The plots above use summary data in the file:
/ux01/davidw/Webdata/usage.sum
How are the numbers determined?
- Unique blogs used:
for each of depts0[1-3] and courses0[12]:
grep "wp-content" /logs/access_log | grep -v wordpress | grep GET | cut -d " " -f7
|cut -d"/" -f2
and add that data to
grep "wordpress" /logs/access_log | grep -v "wp-content" | grep GET | cut -d " " -f
7 |cut -d"/" -f2
then take that data and
sort | uniq -c | sort -nr | wc -l
- Overall usage:
How many accounts use the UA Streaming server disk storage?
How much disk space are those folks using?
![[University of Washington]](http://www.washington.edu/
home/graphics/uwid.gif) |
UW Information Technology
David Wall davidw@uw.edu
Modified: 26 Apr 2011
|


