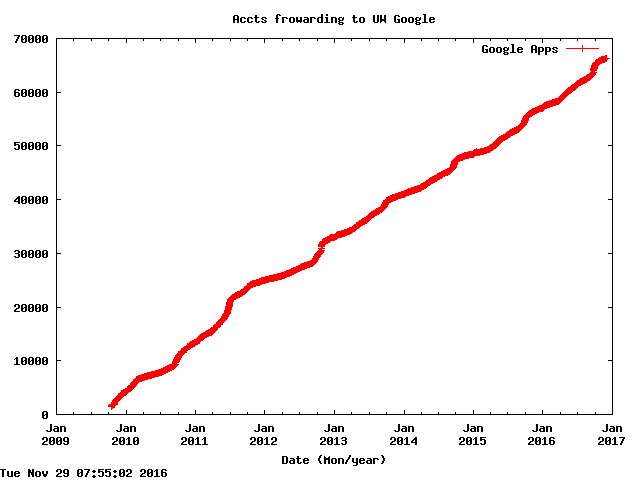
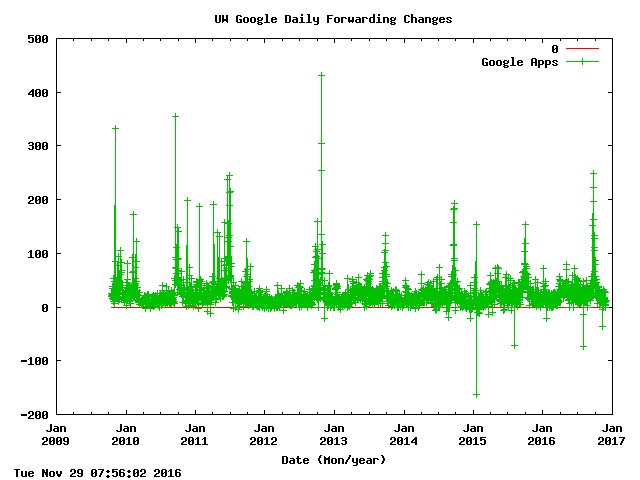
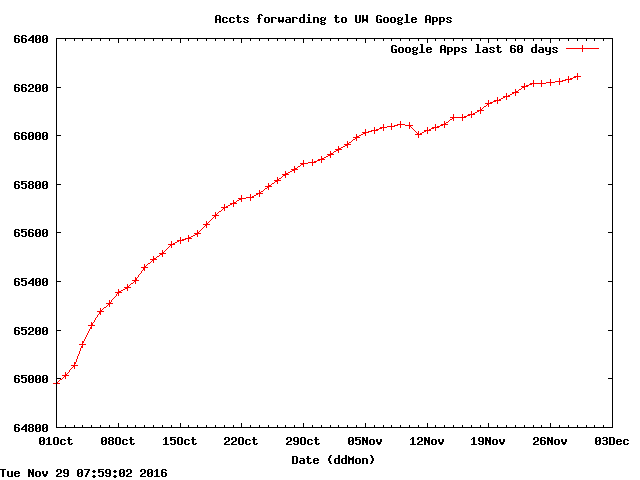
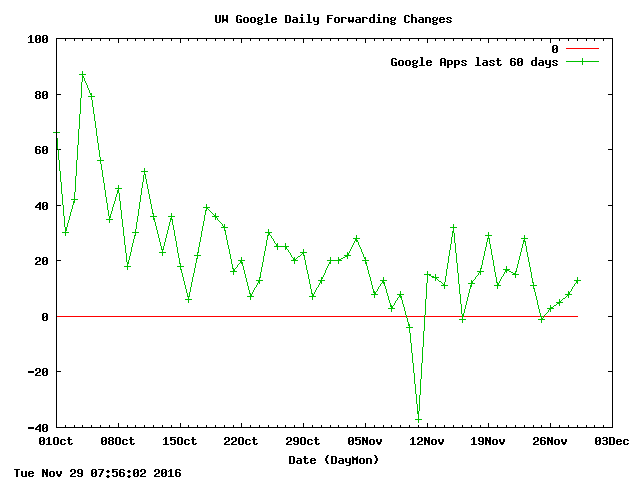
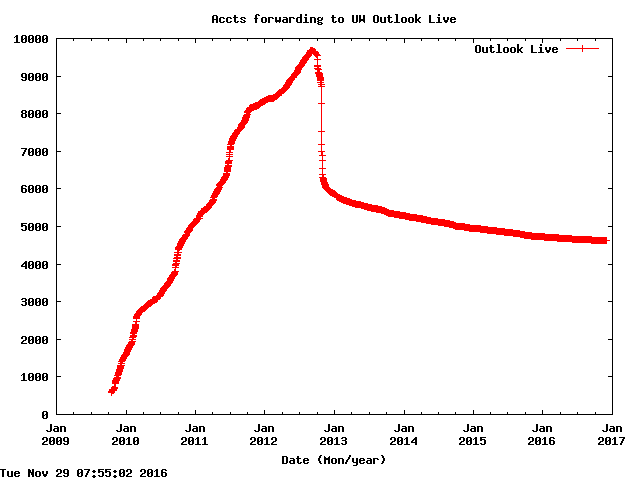
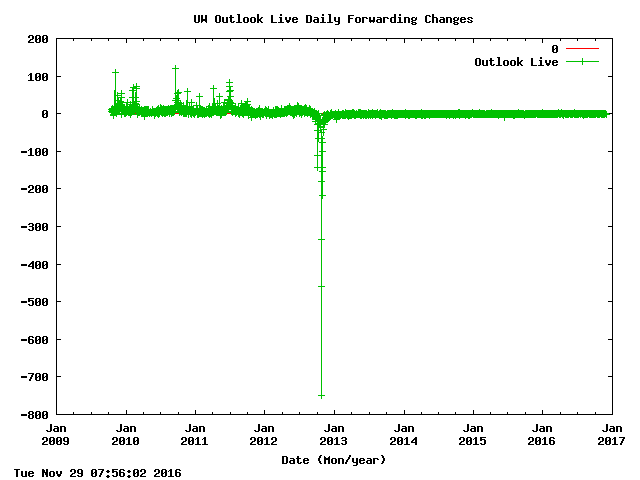
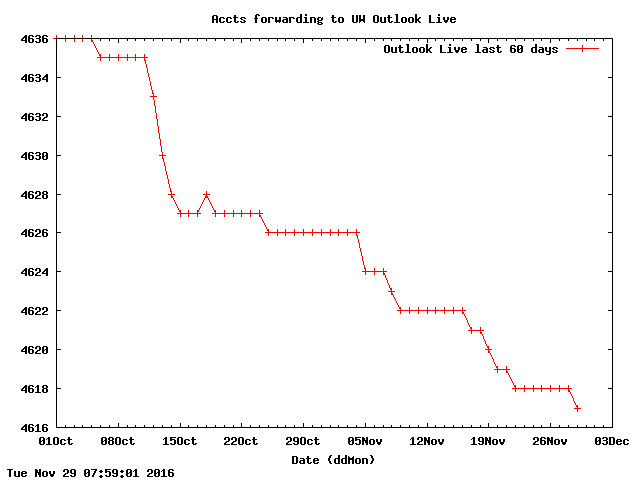
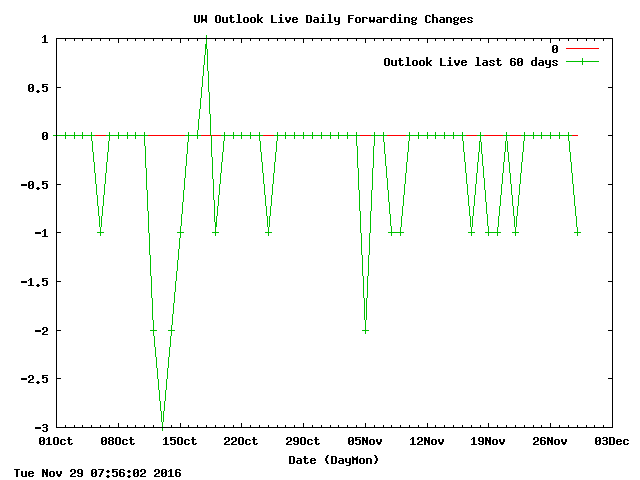
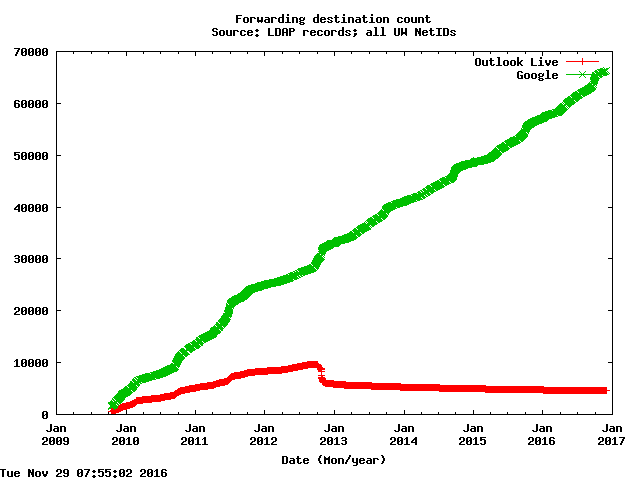
These graphs are produced by taking a snapshot each day of the LDAP forwarding data. A total is calculated for each of the destinations: UW Google Apps, UW Outlook Live, UW Exchange and deskmail. The totals are then ploted as "Count of forwarding destinations" and the change in totals from the day before are ploted as "Daily net change." A data range from December 2009 to present is followed by plots showing only the most recent 60 day period.
| Count of forwarding destinations | Daily net change |
| | |
| | |
| | |
| | |
|
|
UW Technology Services David Wall davidw@uw.edu Modified: 15 Oct 2010 |