David Wall davidw@uw.edu
Modified: 04 June 2012
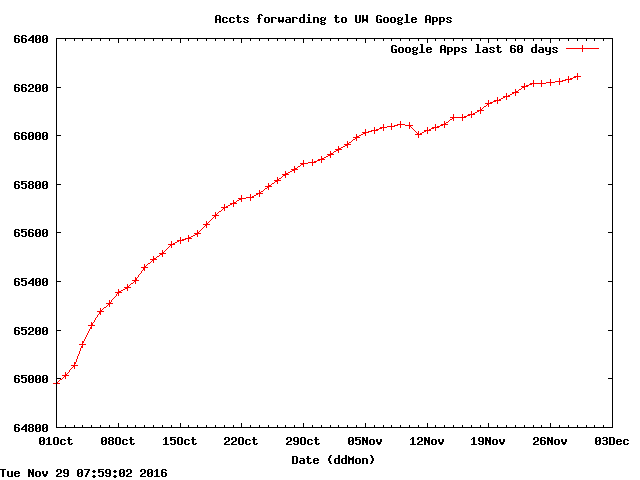
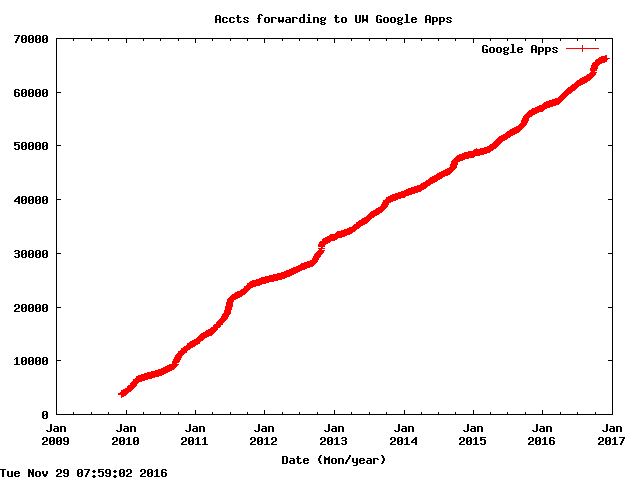
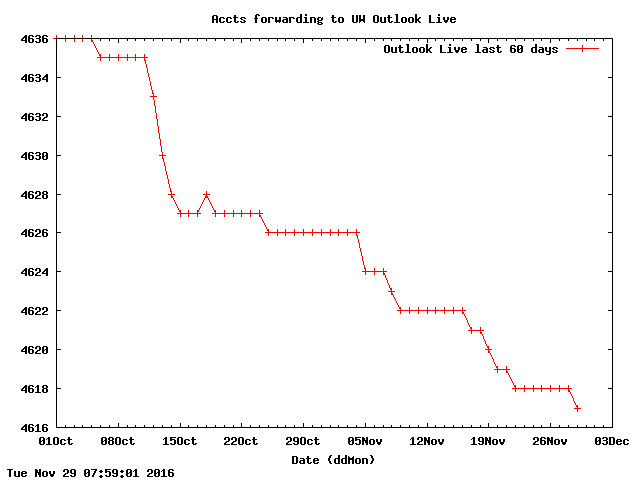
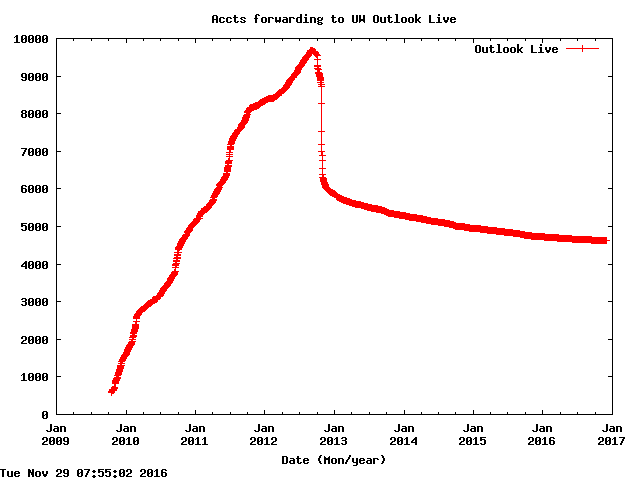
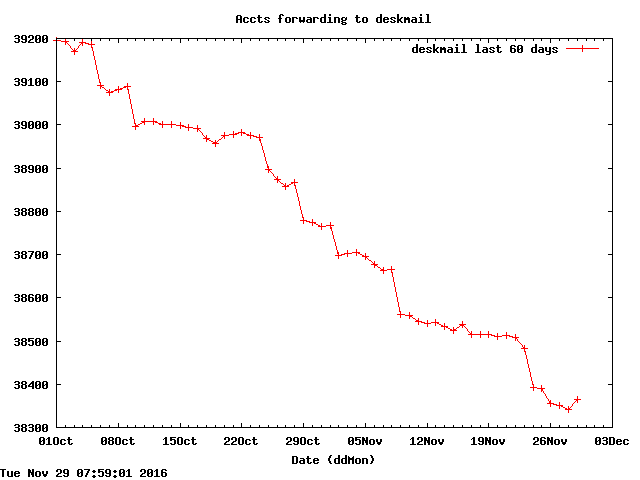
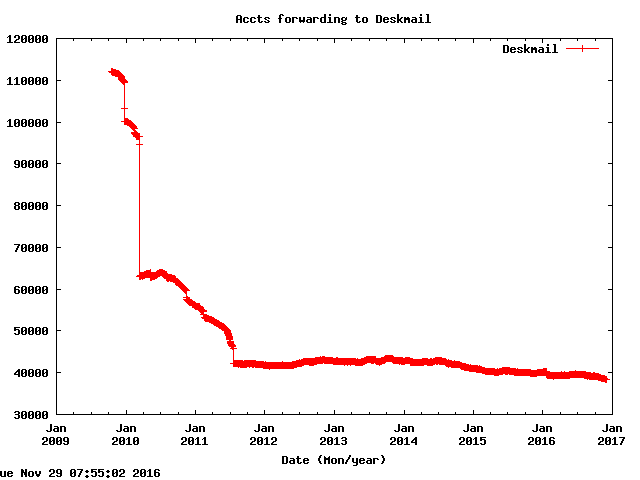
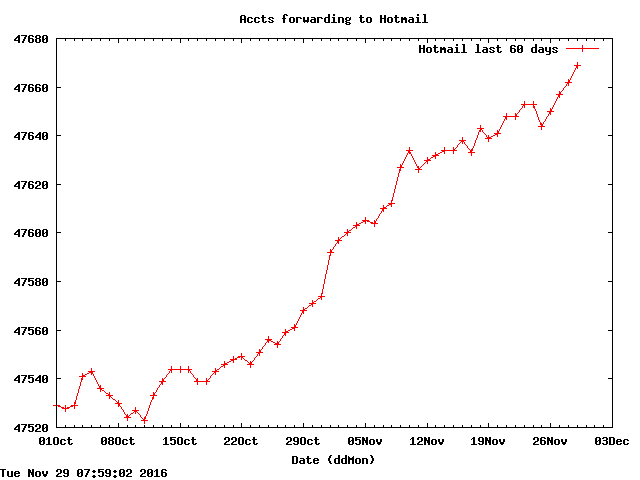
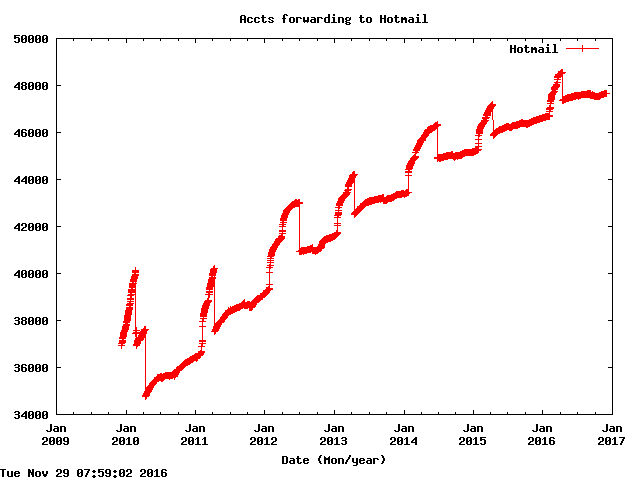
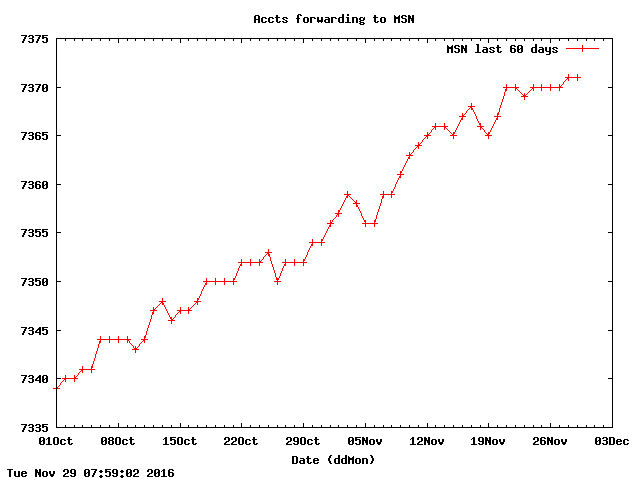
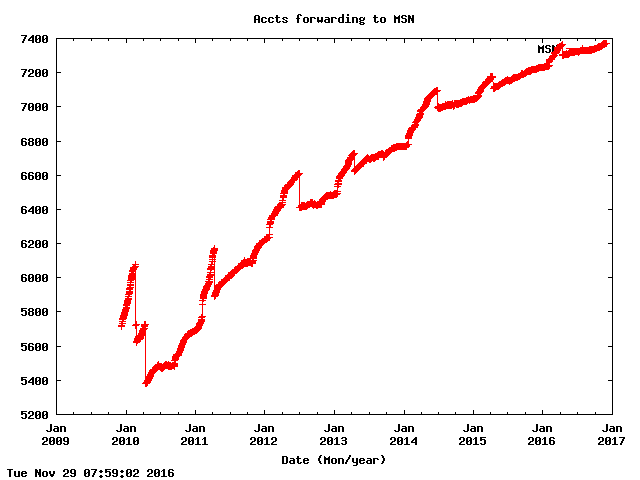
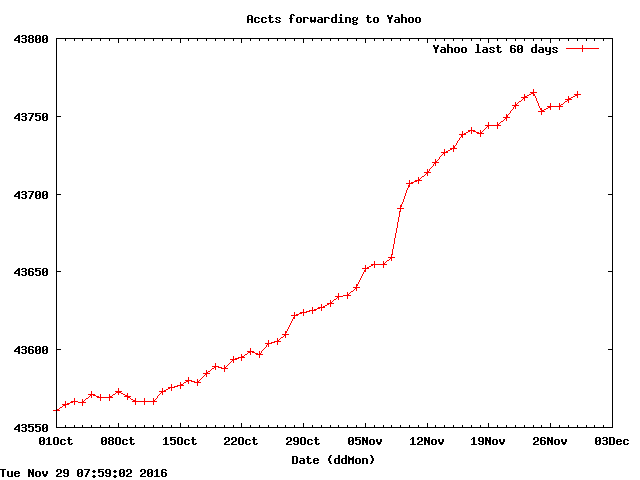
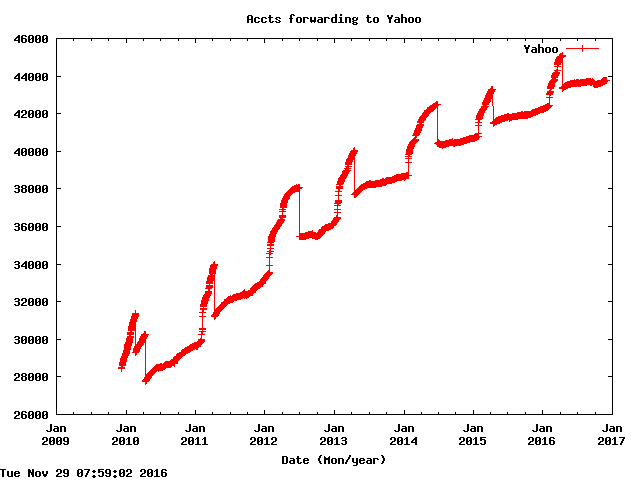
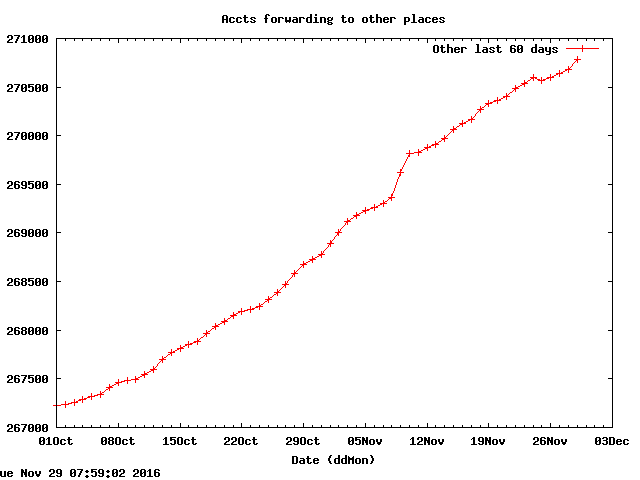
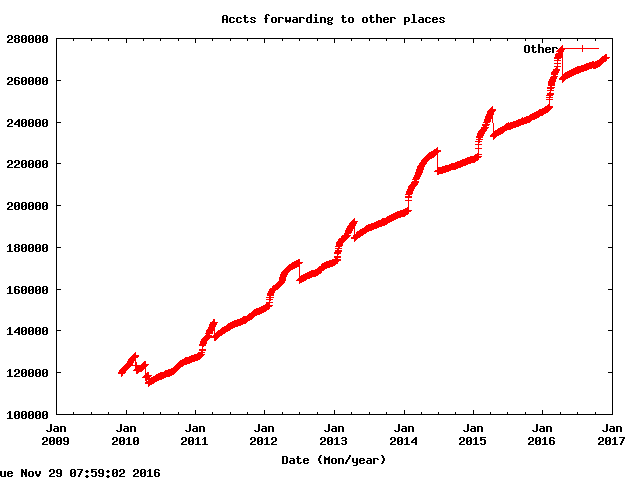
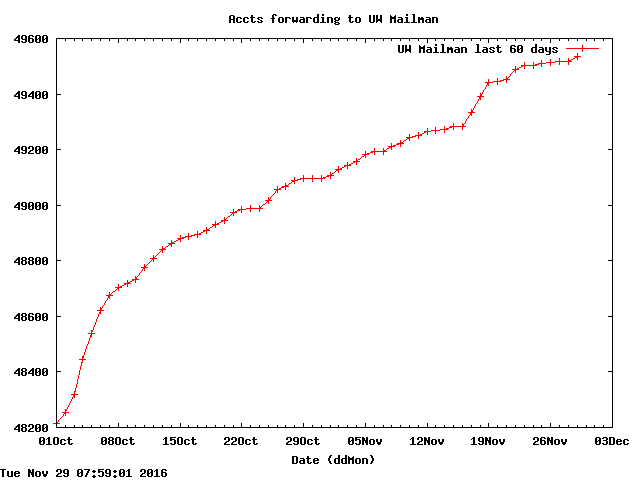
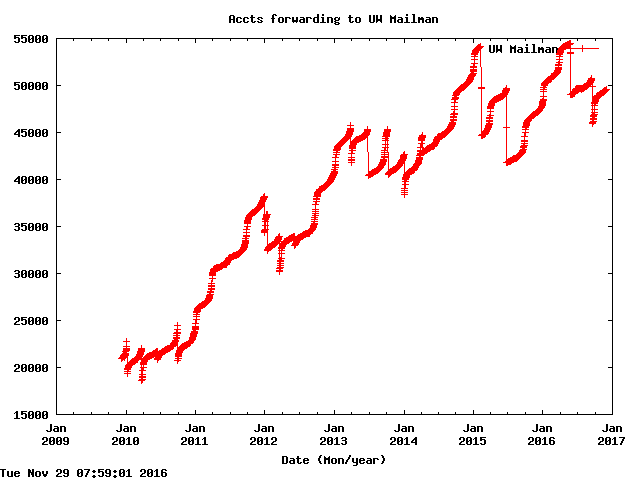
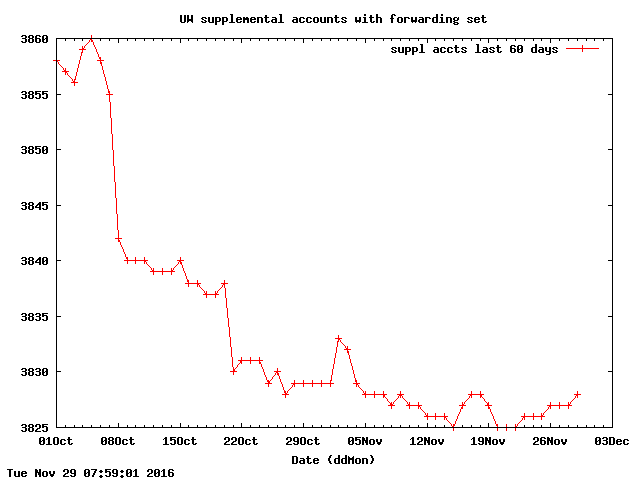
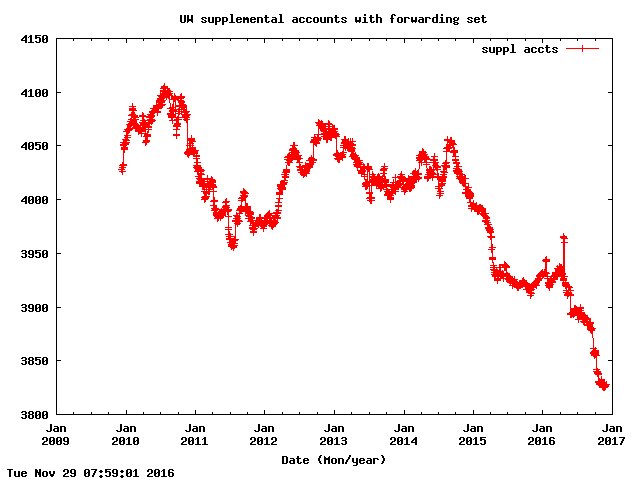
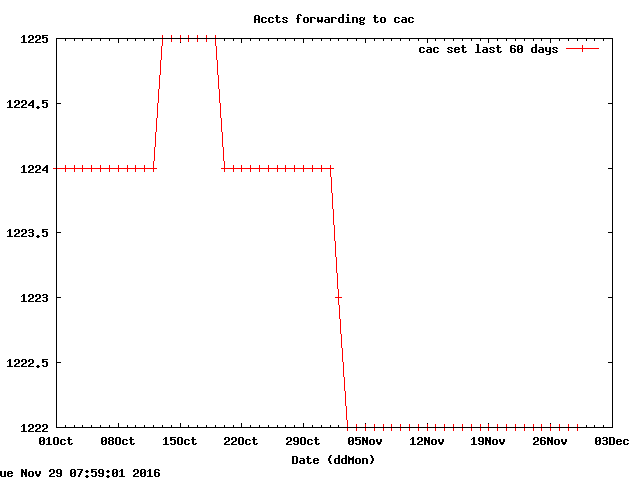
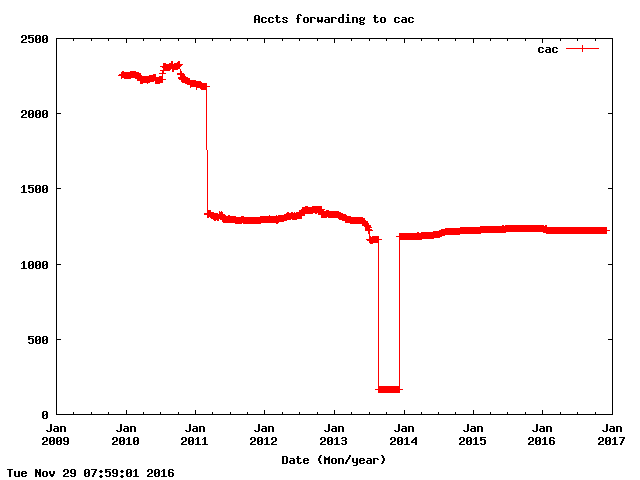
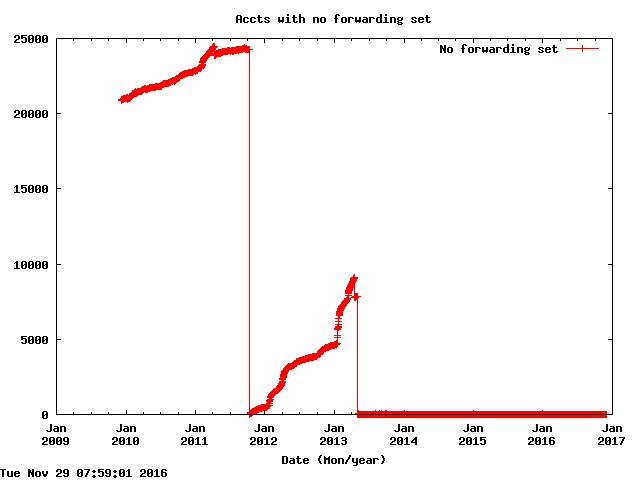
These graphs are produced by taking a snapshot each day of the LDAP forwarding data. A total is calculated for each of the destinations: UW Google Apps, UW Outlook Live, UW Exchange and deskmail. The totals are then ploted as "Count of forwarding destinations" and the change in totals from the day before are ploted as "Daily net change."
When this page gets more polished, it'll show a long term graph and a
recent 60 window of how many accounts forward to the list of destinations.
Yet to come is a presentation of daily changes for short and long periods.
To see just the longer view check out Cloud forwarding graphs.
|
|
UW Technology Services David Wall davidw@uw.edu Modified: 04 June 2012 |