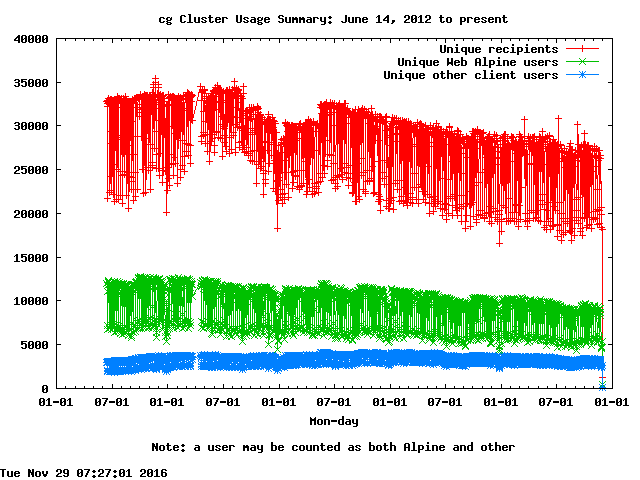
These graphs are produced by extracting user data from /var/log/mail.log on each server in the cg cluster, then counting
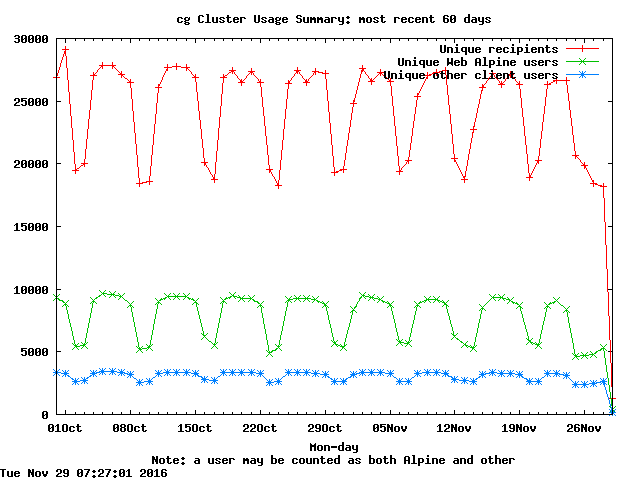
| cg Daily Usage Count | cg Daily Usage -- last 60 days |
| | |
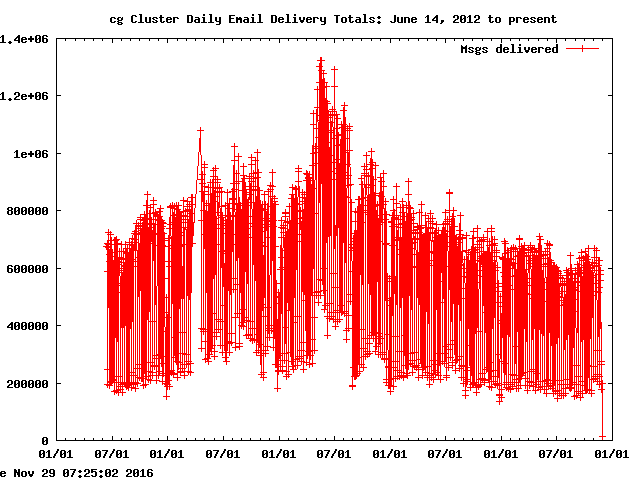
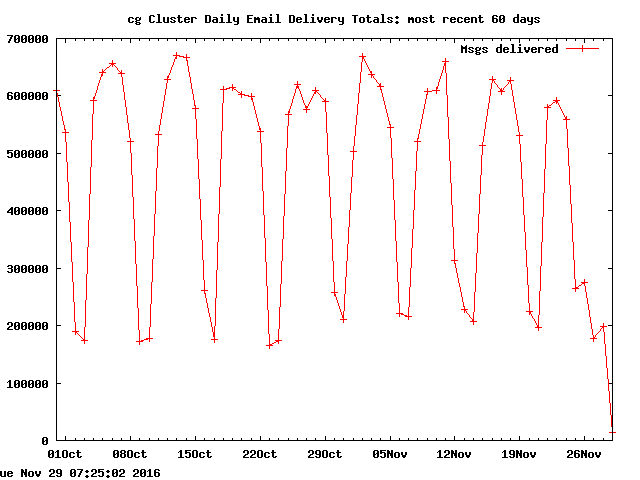
| cg Daily Messages Delivered | cg Daily Messages Delivered -- last 60 days |
| | |
|
|
UW Technology Services David Wall davidw@uw.edu Modified: 22 June 2012 |